Fig. 2
Download original image
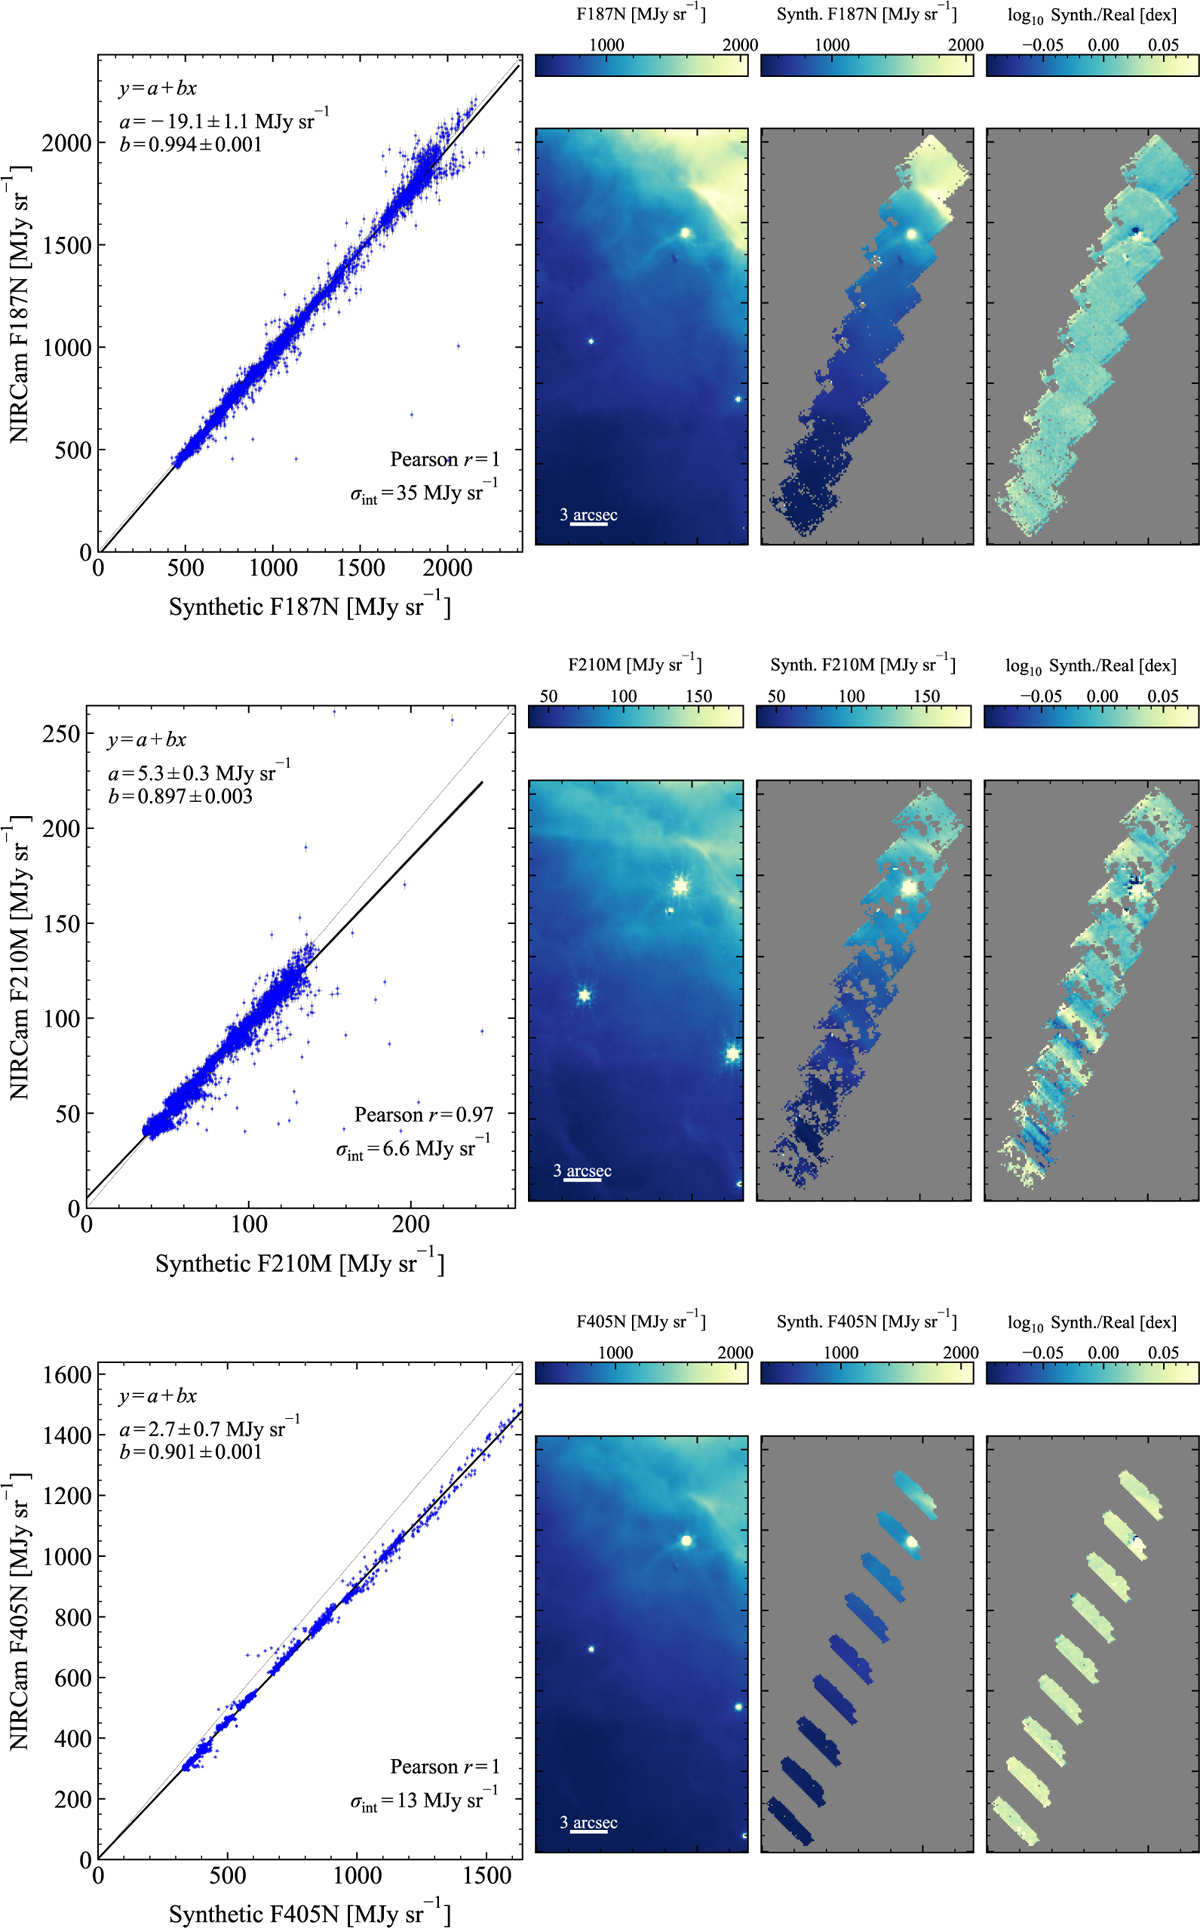
NIRSpec/NIRCam cross-calibration results for selected NIRCam filters: F187N (top row), F210M (middle row), and F405N (bottom row). From left to right: linear fit of fluxes from individual pixels from the real NIRCam image (y-axis) and synthetic NIRCam image (x-axis); NIRCam image zoomed in on the NIRSpec FoV; synthetic image measured from the un-stitched, uncalibrated NIRSpec cube; ratio of the synthetic image to the real image. The best-fit parameters are shown in the top left panel of each scatter plot and are given in Table 1. The thin dotted line is a 1:1 relationship. See Section 3.2.1 for further details. Versions of this figure for F335M and F212N are shown in Appendix A. Some pixels are missing from the synthetic images due to the physical gap between detectors (affecting F405N), and artifacts stemming from the NIRSpec data reduction pipeline.
Current usage metrics show cumulative count of Article Views (full-text article views including HTML views, PDF and ePub downloads, according to the available data) and Abstracts Views on Vision4Press platform.
Data correspond to usage on the plateform after 2015. The current usage metrics is available 48-96 hours after online publication and is updated daily on week days.
Initial download of the metrics may take a while.