Open Access
Fig. C.9
Download original image
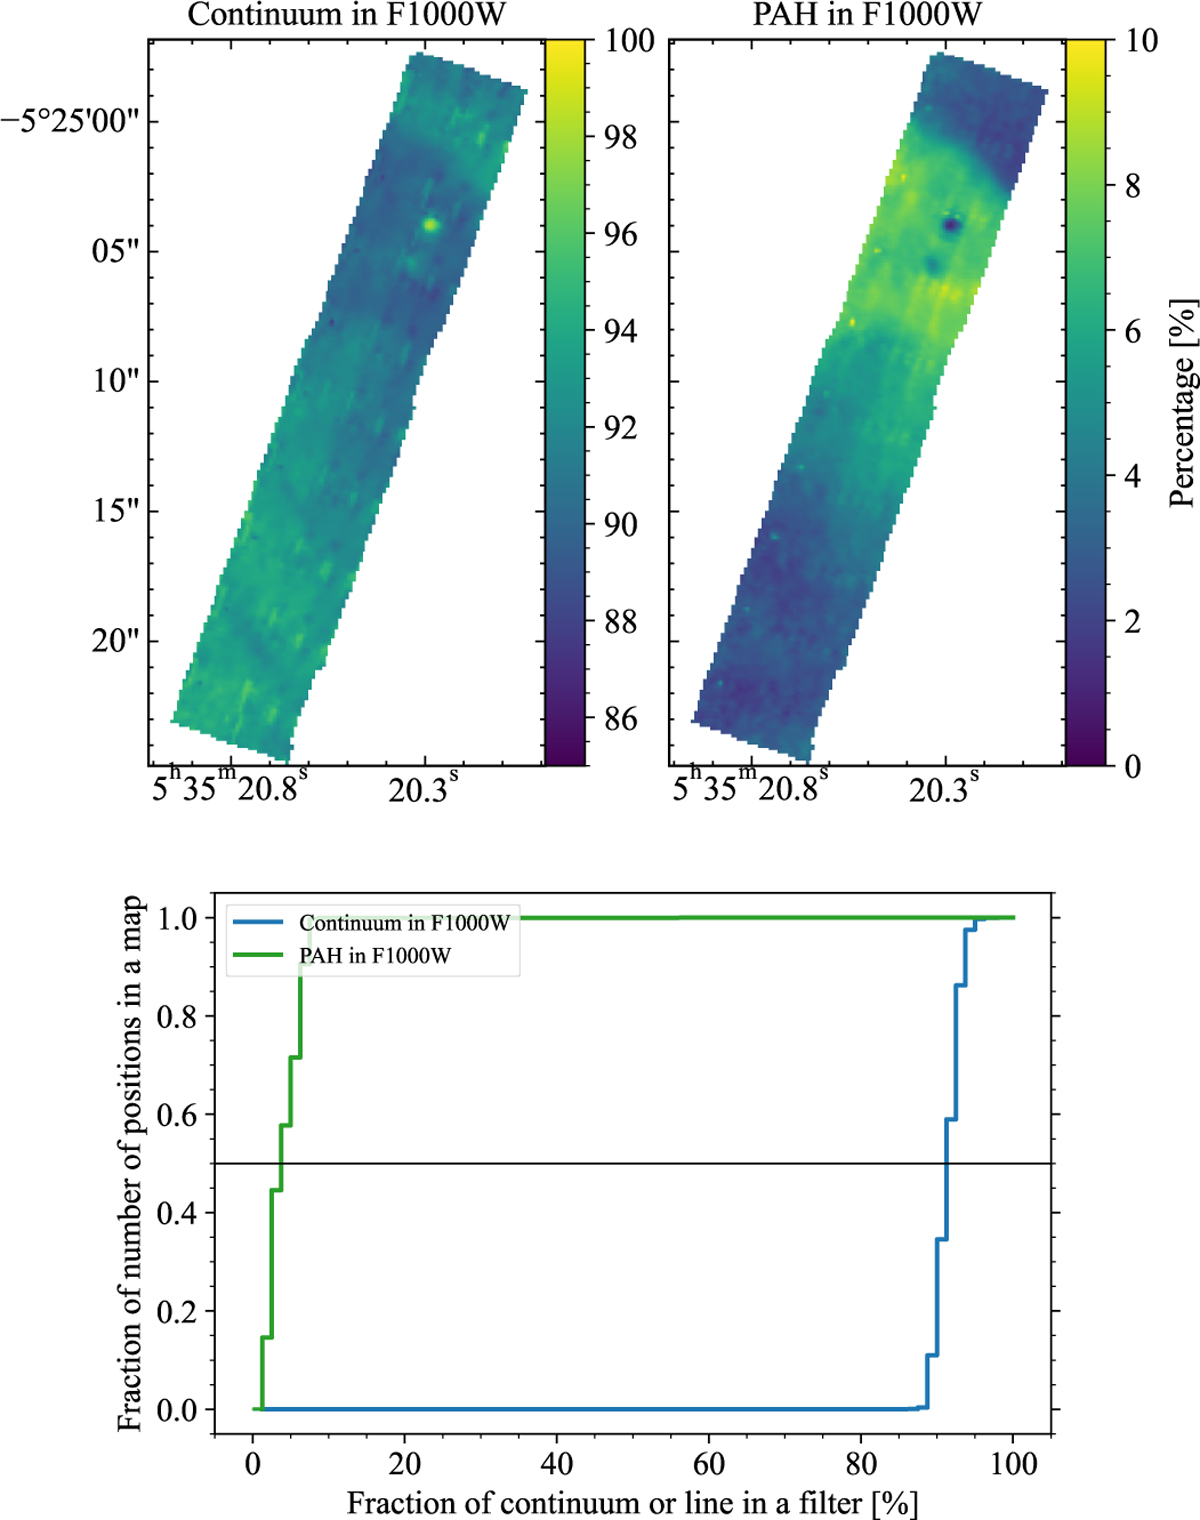
Analysis of the continuum and PAH emission in F1000W calculated from the MRS spectra. Top: Maps of continuum fraction in F1000W (left) and PAH fraction (right). Bottom: Cumulative histograms of the continuum and PAH fractions in top panels.
Current usage metrics show cumulative count of Article Views (full-text article views including HTML views, PDF and ePub downloads, according to the available data) and Abstracts Views on Vision4Press platform.
Data correspond to usage on the plateform after 2015. The current usage metrics is available 48-96 hours after online publication and is updated daily on week days.
Initial download of the metrics may take a while.