Fig. C.8
Download original image
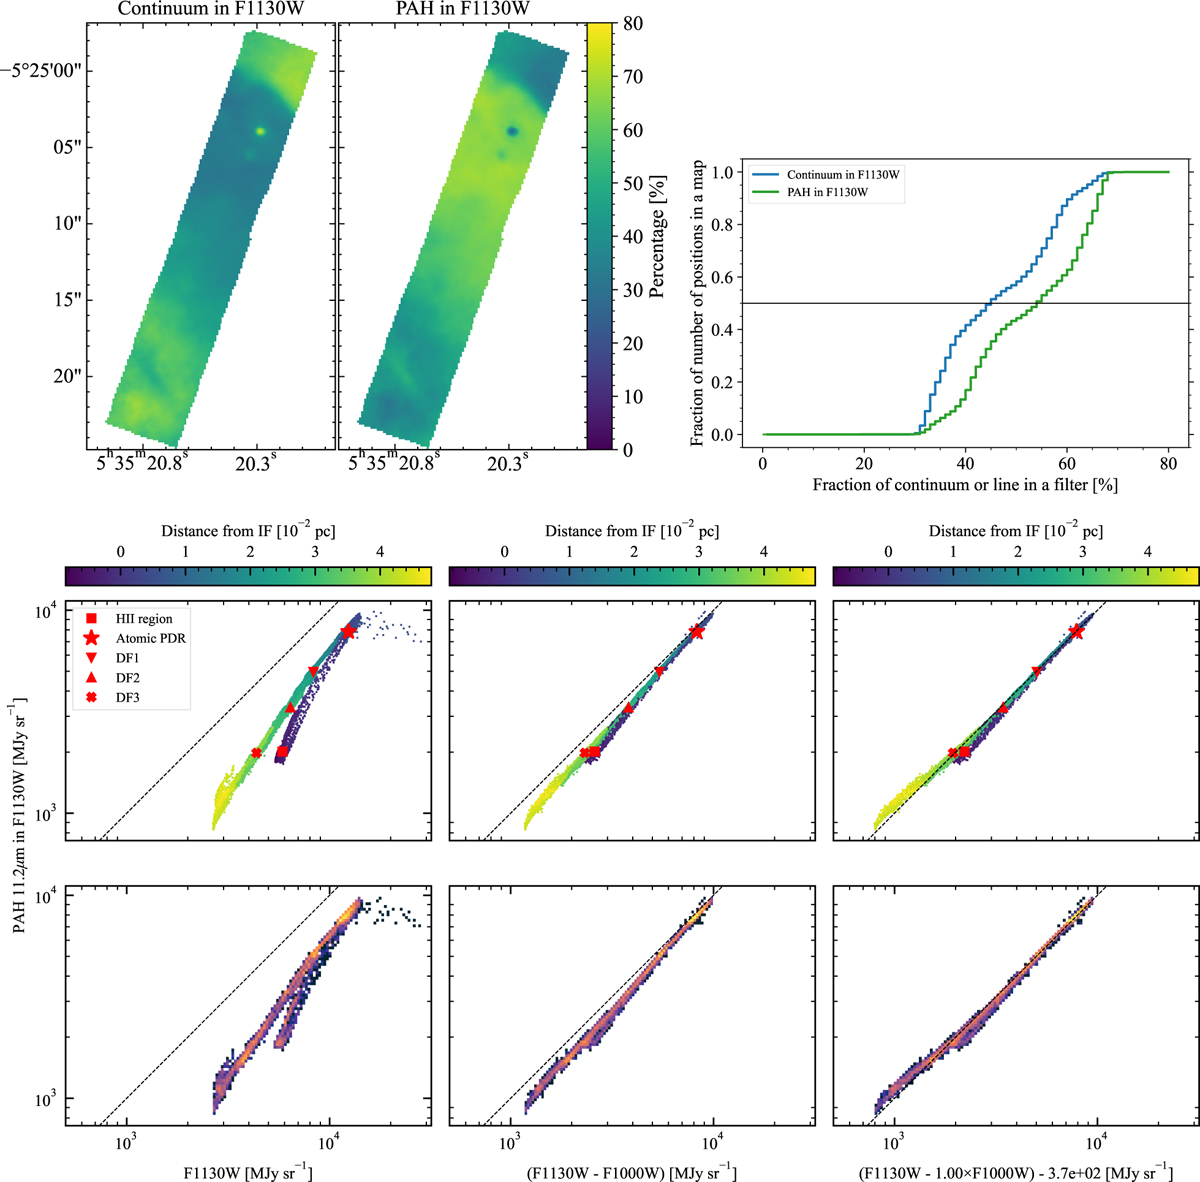
Top left: Maps of continuum fraction in F1130W (left) and PAH (right). Top right: Cumulative histograms of the continuum and PAH fractions in top panels. Horizontal black line indicates 50%, i.e., the median value. Bottom: Correlation between the synthetic images (left: F1130W, middle: F1130W-F1000W, right: the best fit with Eq. 5) and the synthetic image of the PAH component in F1130W. Colors indicate the distance from the ionization front as in Fig. 4. Red marks indicate the data points of the five template spectra.
Current usage metrics show cumulative count of Article Views (full-text article views including HTML views, PDF and ePub downloads, according to the available data) and Abstracts Views on Vision4Press platform.
Data correspond to usage on the plateform after 2015. The current usage metrics is available 48-96 hours after online publication and is updated daily on week days.
Initial download of the metrics may take a while.