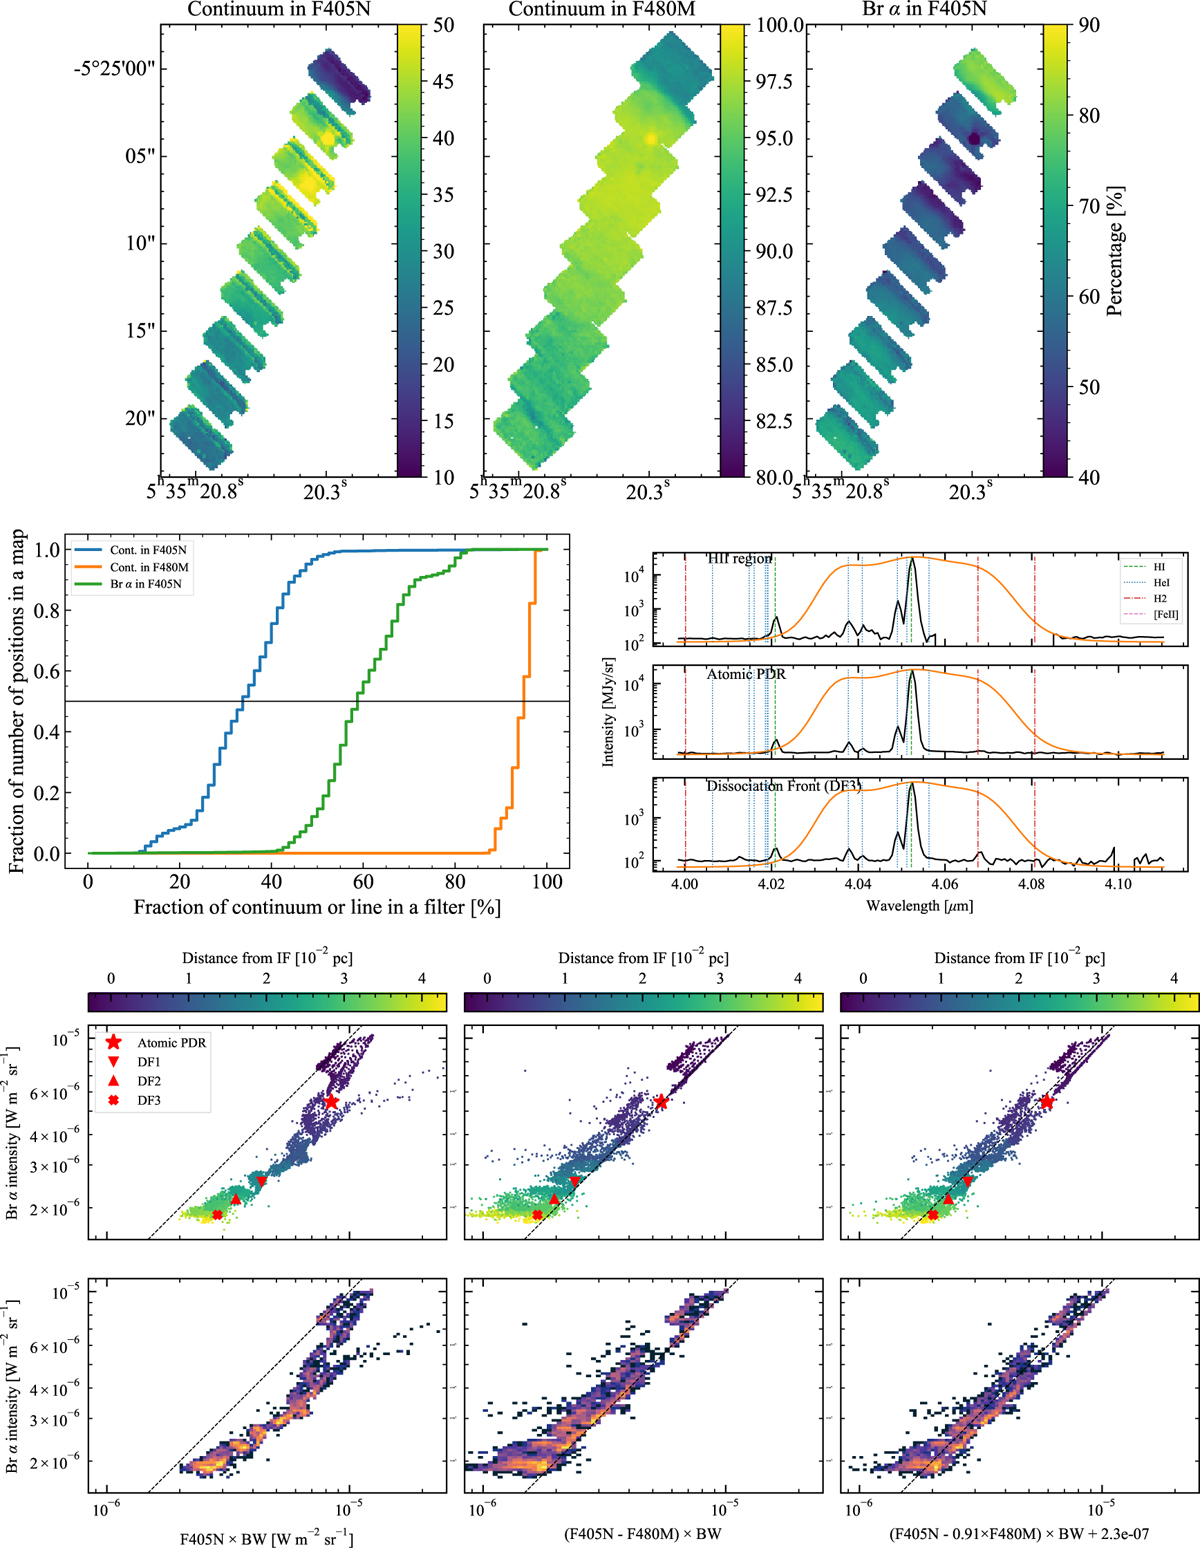
Fig. C.5
Download original image
Analysis of the continuum and Br α in F405N and F480M calculated from the NIRSpec spectra. Top: Maps of continuum fraction in F405N and F480M (left two panels) and Br α (right two panels). Middle left: Cumulative histograms of the continuum and line fractions in top panels. Middle right: Template spectra in the range covered by F405N. Bottom: Correlation between the synthetic images (left: F405N, middle: F405N–F480M, right: the best fit with Eq. 5) and the measured Br α line intensities. We excluded the data point of the HII region template, because the wavelength of Br α falls into the gap of NIRSpec in most of the pixels that consist of the template, and thus it does not represent well the template region. Symbols, lines, and plot types are the same as in Fig. 4. See Sect. 4.3.6 for details.
Current usage metrics show cumulative count of Article Views (full-text article views including HTML views, PDF and ePub downloads, according to the available data) and Abstracts Views on Vision4Press platform.
Data correspond to usage on the plateform after 2015. The current usage metrics is available 48-96 hours after online publication and is updated daily on week days.
Initial download of the metrics may take a while.