Fig. C.4
Download original image
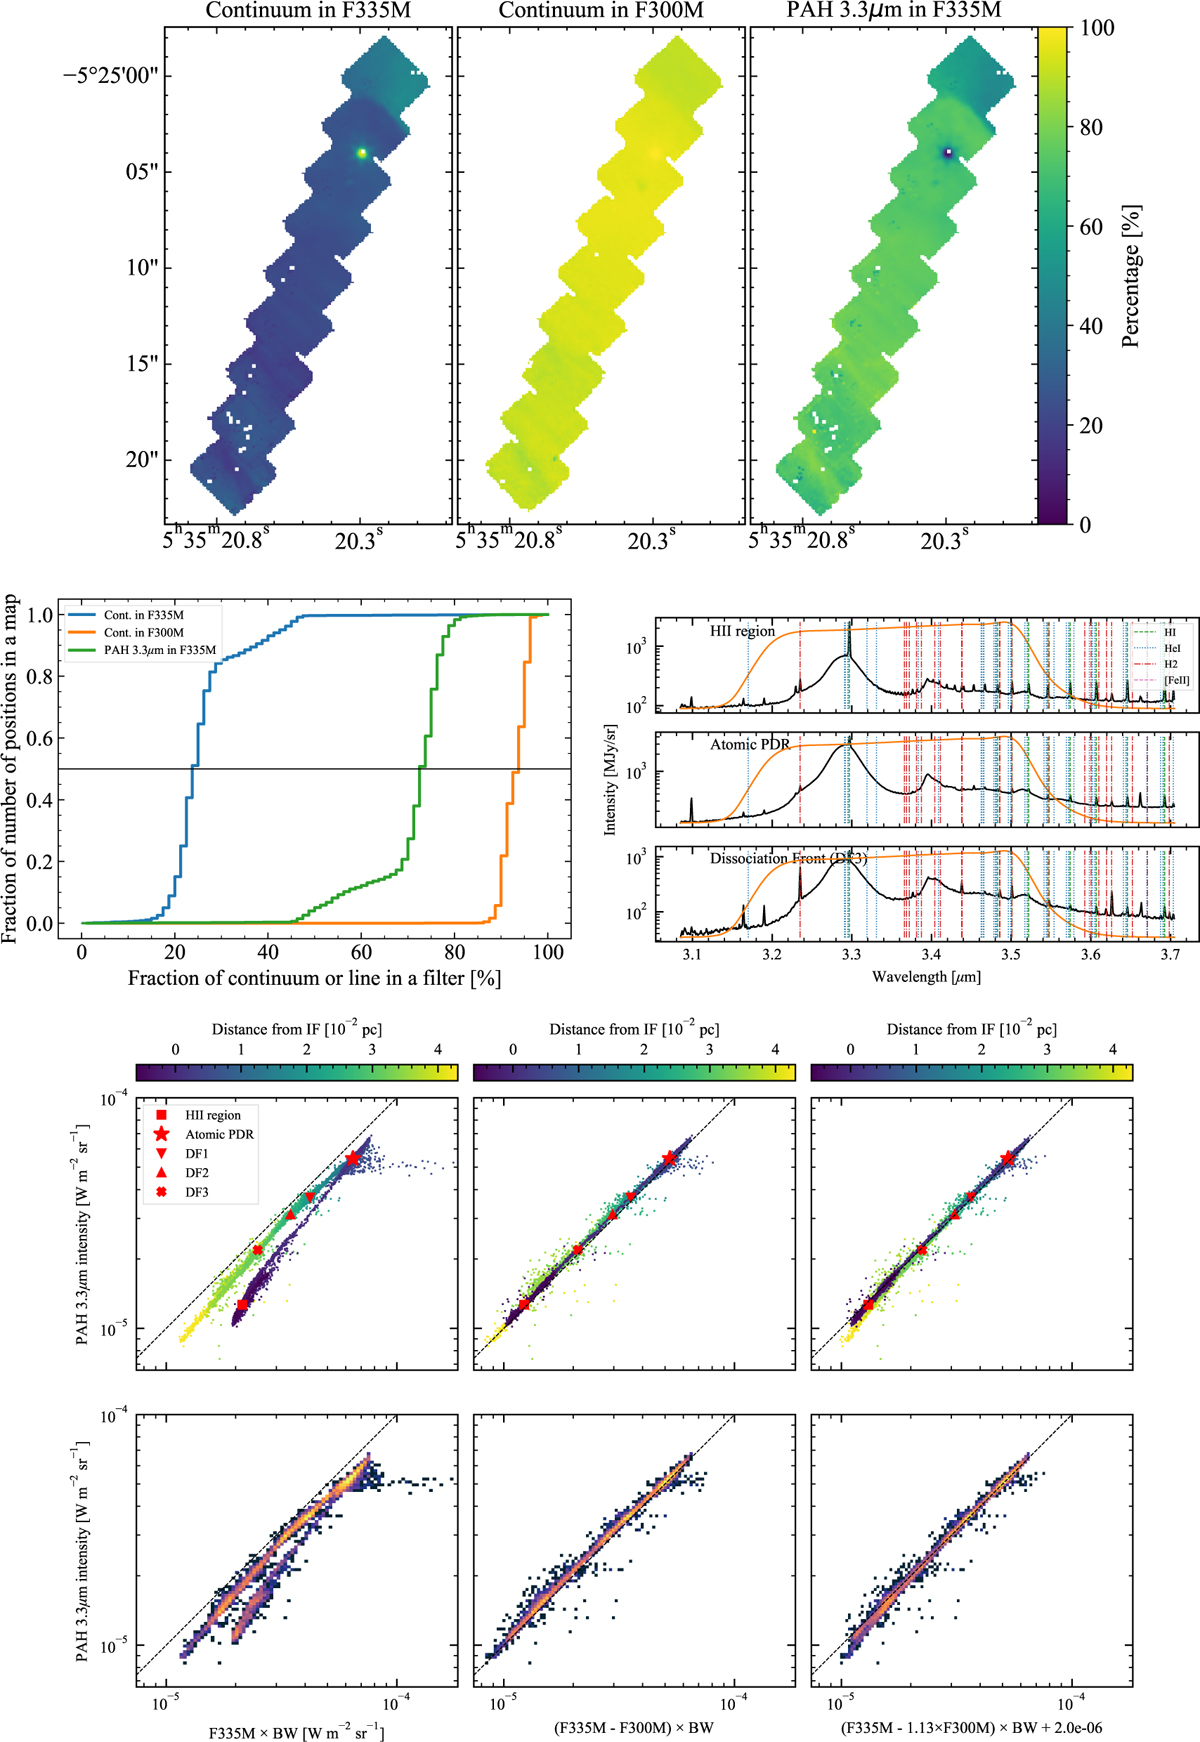
Analysis of the continuum and PAH 3.3 μm emission in F335M and F300M calculated from the NIRSpec spectra. Top: Maps of the continuum fraction in F335M and F300M (left two panels) and the PAH 3.3 μm (right). The PAH 3.3 μm is outside of the filter F300M so its fraction in F300M is not shown. Middle left: Cumulative histograms of the continuum and line fractions in top panels. Middle right: Template spectra in the range covered by F335M. Bottom: Correlation between the synthetic images (left: F335M, middle: F335M–F300M, right: the best fit with Eq. 5) and the measured PAH intensities. Symbols, lines, and plot types are the same as in Fig. 4. See Sect. 4.3.5 for details.
Current usage metrics show cumulative count of Article Views (full-text article views including HTML views, PDF and ePub downloads, according to the available data) and Abstracts Views on Vision4Press platform.
Data correspond to usage on the plateform after 2015. The current usage metrics is available 48-96 hours after online publication and is updated daily on week days.
Initial download of the metrics may take a while.