Fig. 12
Download original image
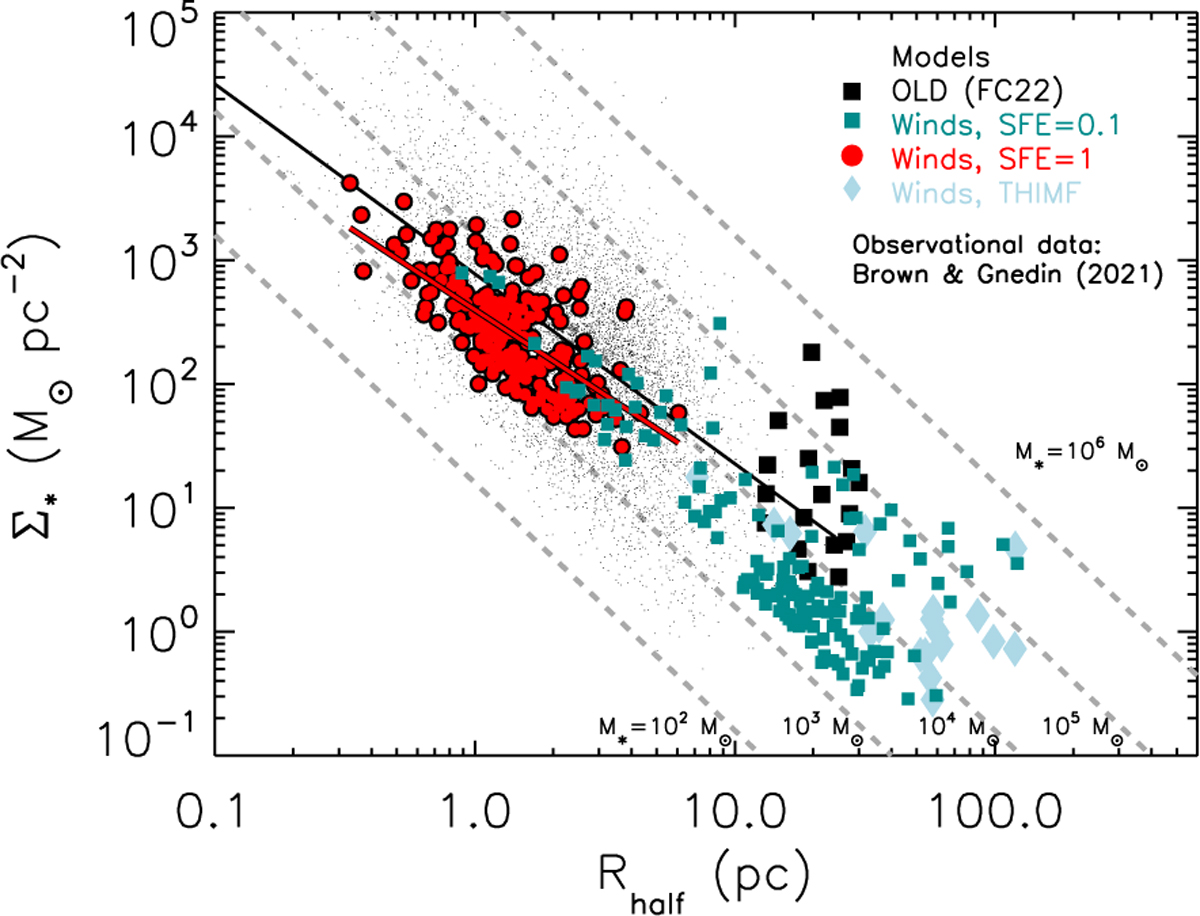
Relation between stellar surface density and size (defined as half-mass or half-light radius) in our simulations and as observed in local star clusters. The black solid squares, dark-cyan solid squares, red solid circles and light-cyan diamonds are the star clusters or clumps retrieved at z = 10.5 in the FC22, ‘Winds, SFE=0.1’, ‘Winds, SFE=1.0’ and ‘Winds, THIMF’ model, respectively, and the small black dots are the observational dataset of young star clusters from the Legacy Extragalactic UV Survey (Ryon et al. 2017; Brown & Gnedin 2021). The thick red and thin black line is a linear fit (in log(∑*) - log(Rhalf) space) to the relation found in the ‘Winds, SFE=1.0’ model and in the observational dataset, respectively. Each grey dashed line represents the relation between Σ* and Rhalf at fixed stellar mass, for which we have considered various values between 102 Mʘ and 106 Mʘ.
Current usage metrics show cumulative count of Article Views (full-text article views including HTML views, PDF and ePub downloads, according to the available data) and Abstracts Views on Vision4Press platform.
Data correspond to usage on the plateform after 2015. The current usage metrics is available 48-96 hours after online publication and is updated daily on week days.
Initial download of the metrics may take a while.