Fig. 1
Download original image
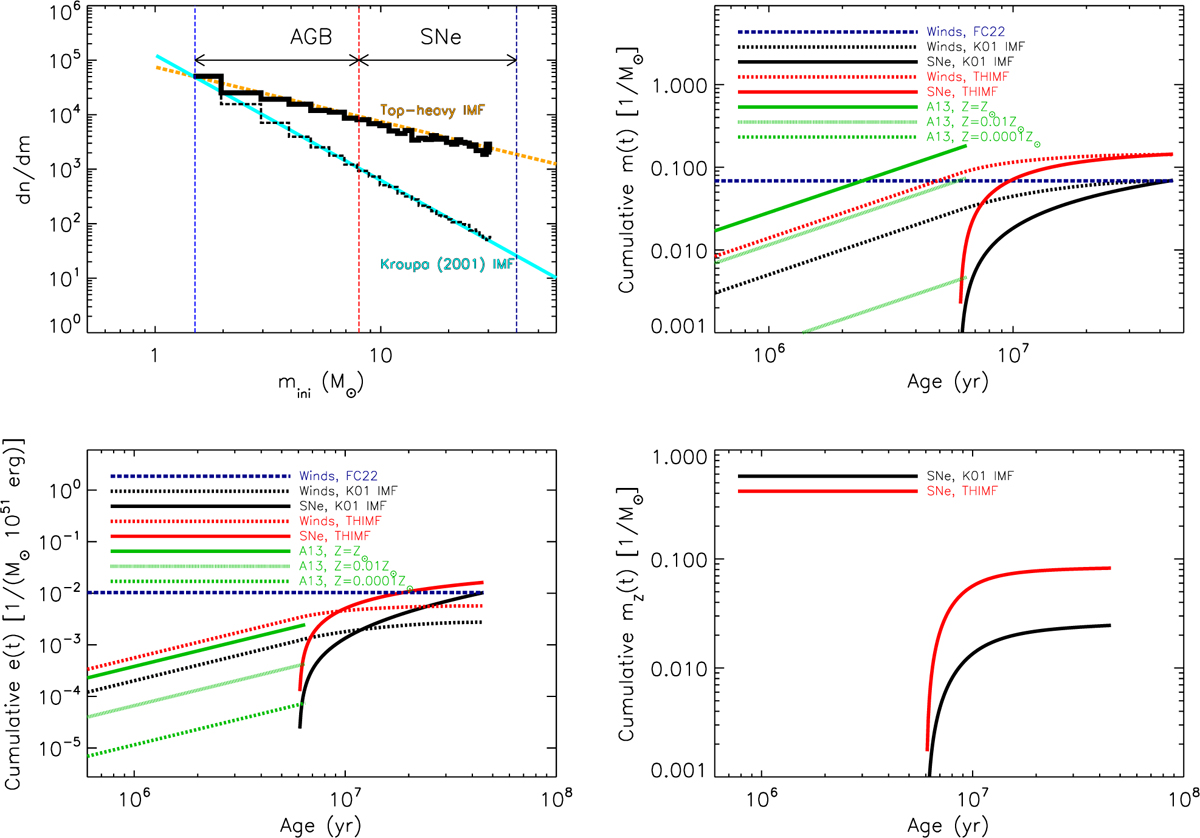
Top-left: stellar IMF computed in this work for a standard (black solid line) and a top-heavy (black dashed line) IMF compared to the analytic ones (cyan solid line: Kroupa (2001); orange dashed line: THIMF). The vertical blue, red and dark-blue dashed lines indicate the minimum mass for individual stars, for massive stars and the maximum mass for SN progenitors, respectively. The top-right is the cumulative mass per unit stellar mass ejected by a stellar population for a Kroupa (2001) (black lines) and top-heavy IMF (red lines) for stellar winds (dashed lines) and SNe (solid lines), whereas the blue dashed line represents the prescriptions for stellar winds ejecta adopted in FC22. The solid, dashed and dotted green straight lines are the metallicity-dependent cumulative mass injected by stellar winds in the model of Agertz et al. (2013) and stopping at t = 6.5 Myr, corresponding to the wind duration in their model. The bottom-left panel is the energy per unit mass and in units of 1051 erg ejected by stellar winds and SNe in a stellar population, with same line types as in the top-right panel. The bottom-right panel is the specific cumulative mass in the form of heavy elements for a standard (black line) and top-heavy (red line) IMF.
Current usage metrics show cumulative count of Article Views (full-text article views including HTML views, PDF and ePub downloads, according to the available data) and Abstracts Views on Vision4Press platform.
Data correspond to usage on the plateform after 2015. The current usage metrics is available 48-96 hours after online publication and is updated daily on week days.
Initial download of the metrics may take a while.