Open Access
Fig. A.1.
Download original image
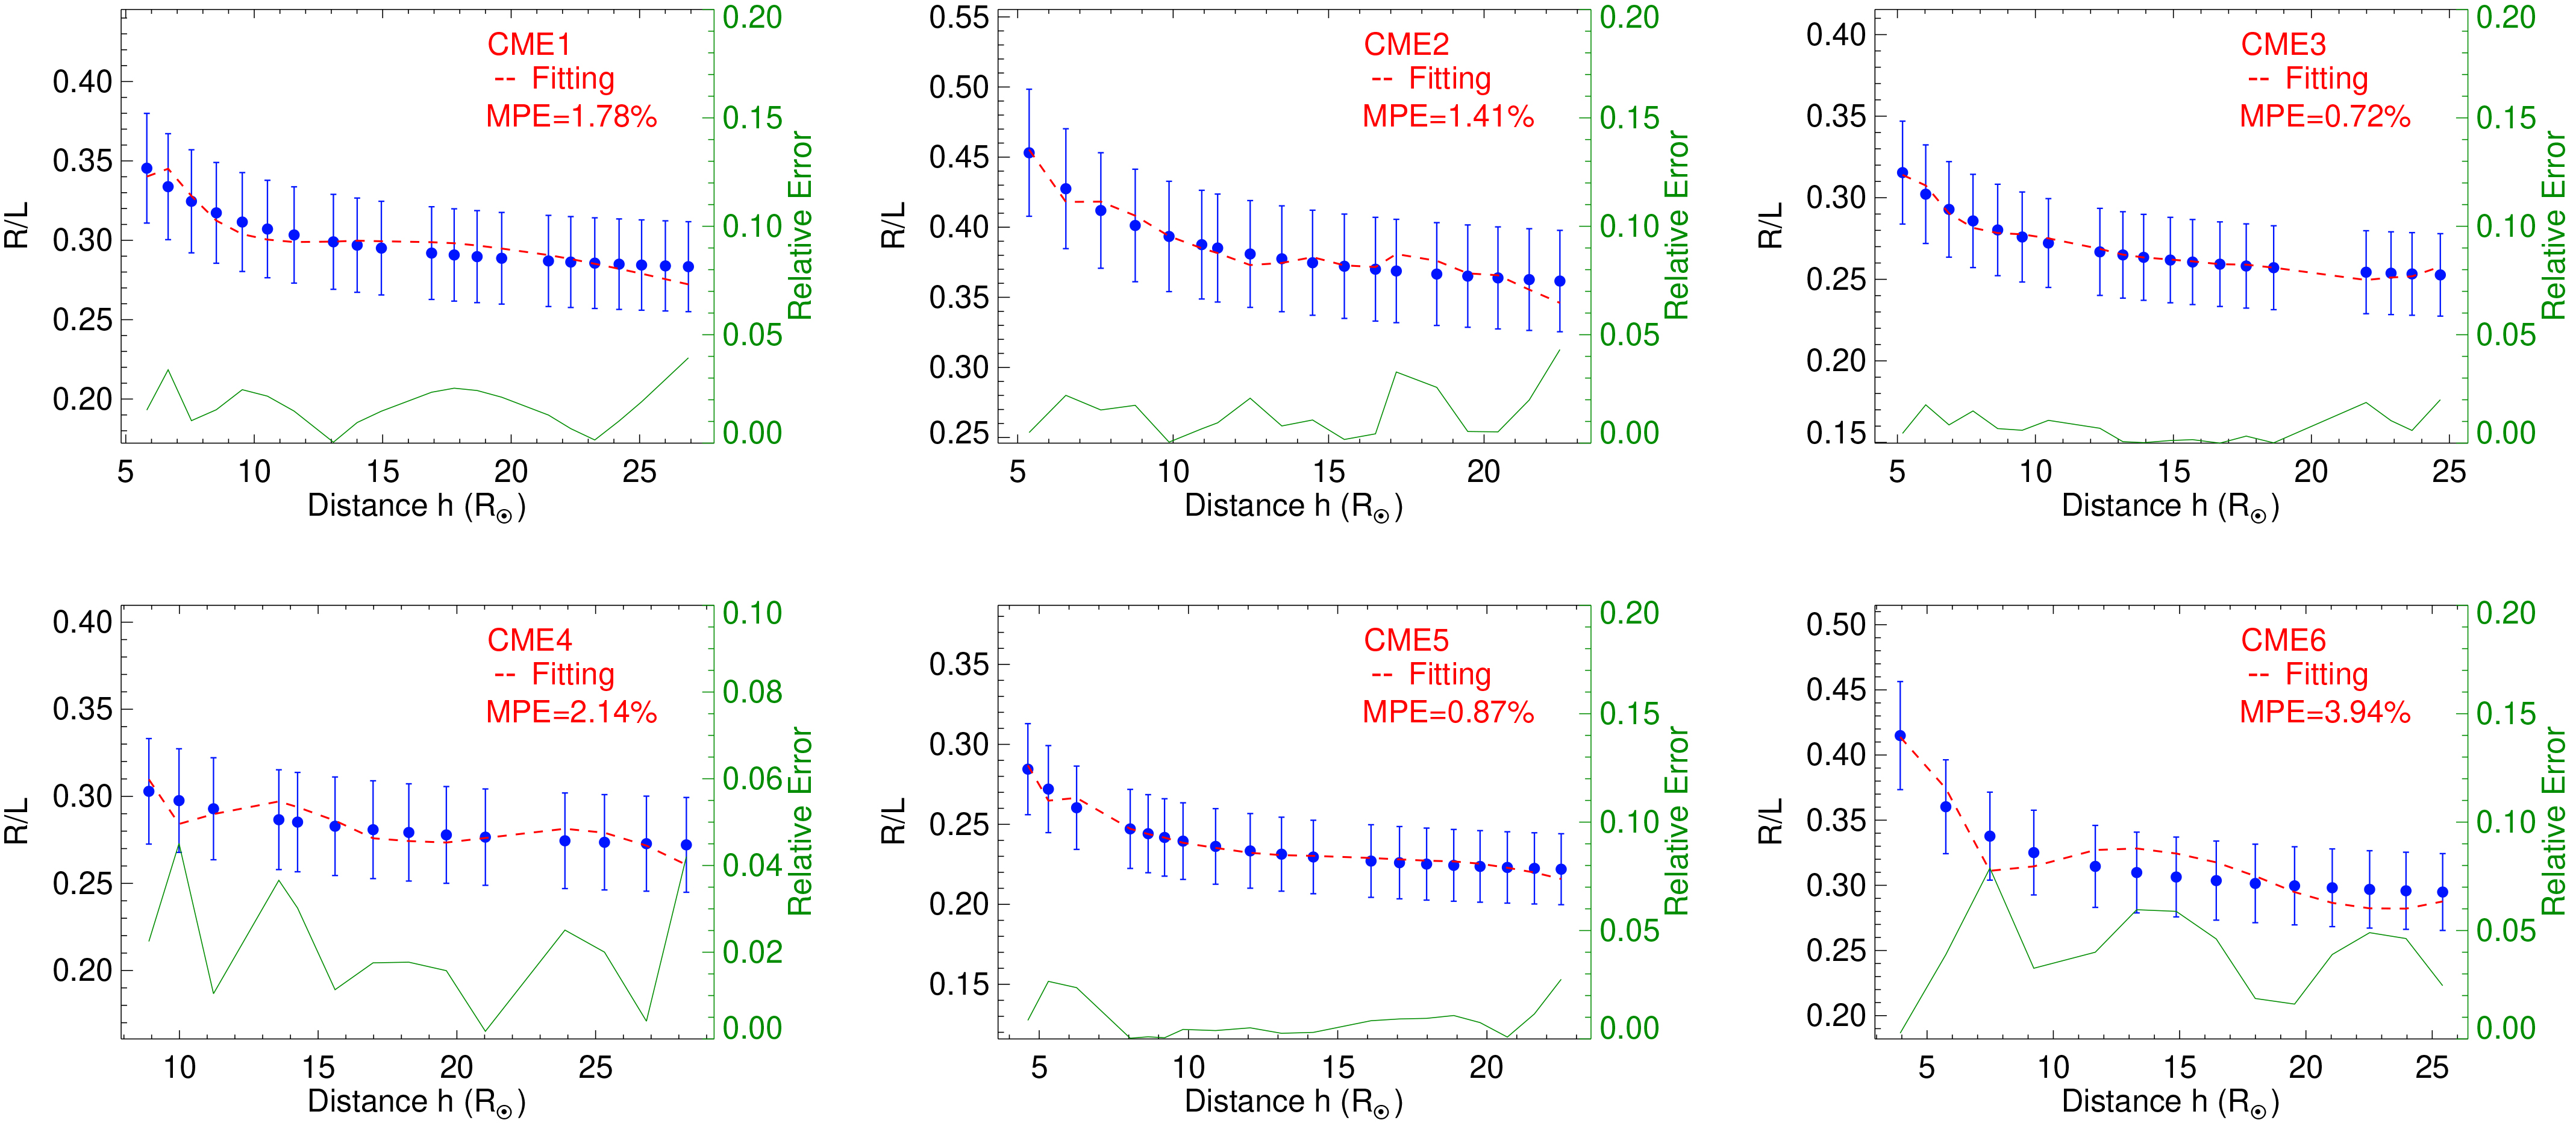
Model-fitting errors for the selected fast CMEs. Blue dots show the left-hand side of Eq. (1), the dashed red line the right-hand side of Eq. (1) from Khuntia et al. (2023), and the green line the relative fitting errors. MPE stands for the mean percentage error.
Current usage metrics show cumulative count of Article Views (full-text article views including HTML views, PDF and ePub downloads, according to the available data) and Abstracts Views on Vision4Press platform.
Data correspond to usage on the plateform after 2015. The current usage metrics is available 48-96 hours after online publication and is updated daily on week days.
Initial download of the metrics may take a while.