Fig. 4.
Download original image
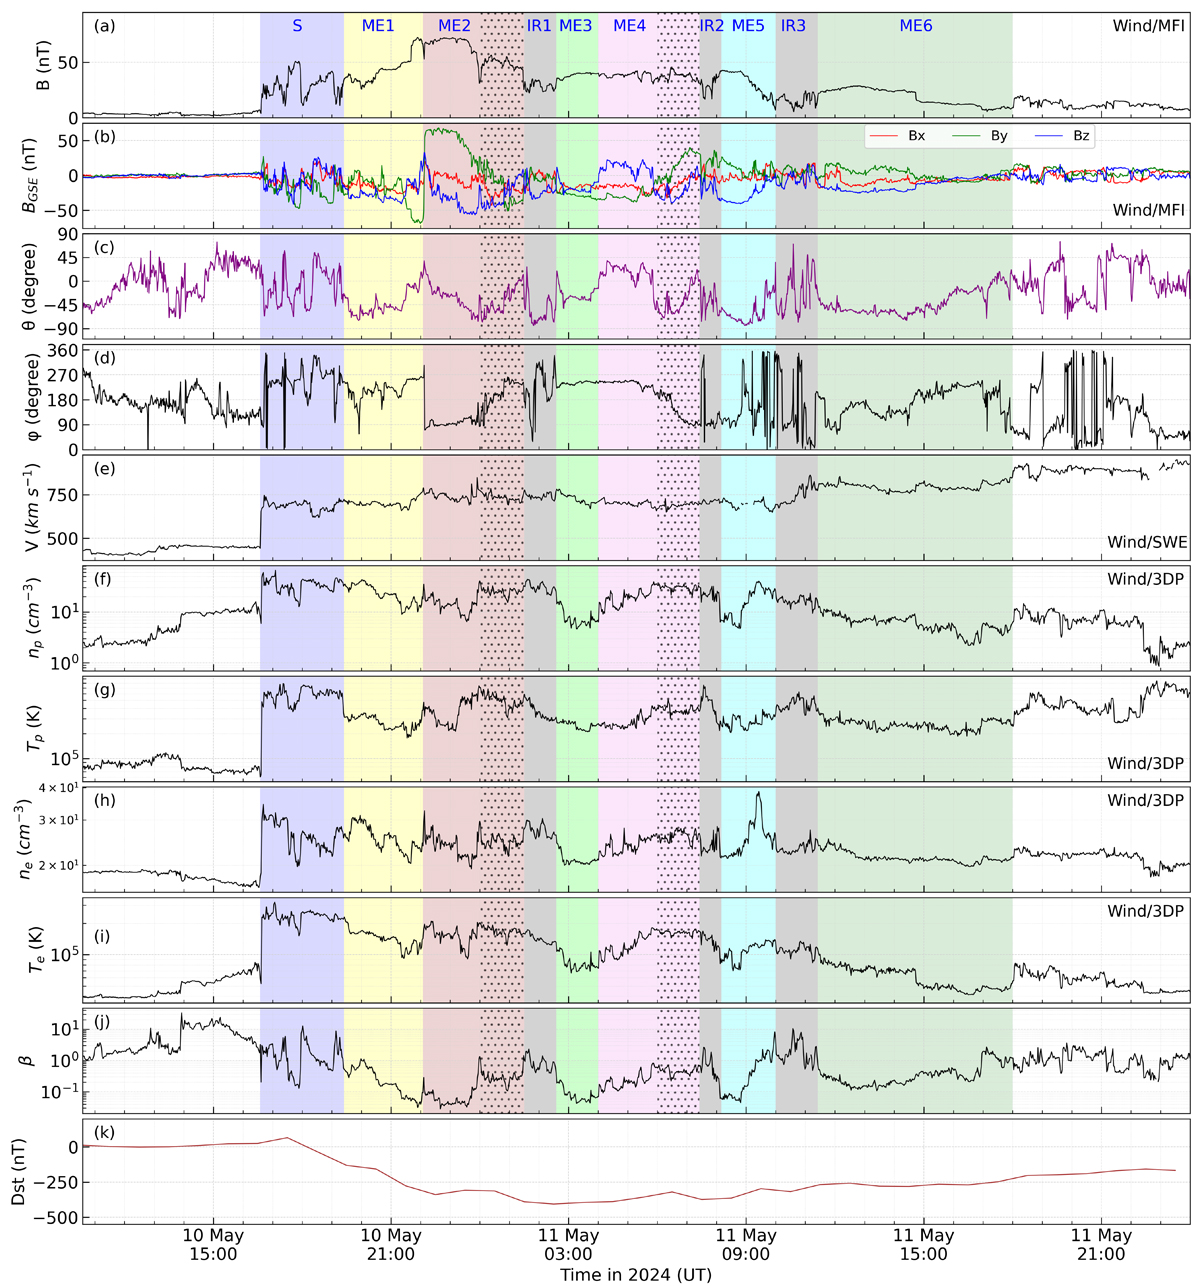
Structures of the CMEs that drove the great geomagnetic storm on 10–11 May 2024, as measured in situ by Wind. Panels (a) and (b): Average magnetic field and its components in GSE coordinates, respectively. Panels (c) and (d): Calculated inclination angle, θ (with respect to the ecliptic plane) and azimuthal angle, ϕ (0 deg pointing to the Sun) of the magnetic field. Panels (e), (f), (g), (h), (i), and (j): Bulk solar wind speed, proton number density, proton temperature, electron number density, electron temperature, and plasma beta, respectively. Panel (k): Dst index value for the selected duration of in situ measurements. The vertical color bars in each panel show the corresponding structures, such as sheath (S), magnetic ejecta (ME), and interaction regions (IRs). The dotted regions following the leading portion within ME2 and ME4 display signatures similar to double FR structures, which may have been inherently present during the eruption or developed later due to CME-CME interaction. The shaded regions have not been overlaid on panel K as the Dst index represents the geomagnetic response and therefore does not align with the measurements from the Wind spacecraft taken at L1.
Current usage metrics show cumulative count of Article Views (full-text article views including HTML views, PDF and ePub downloads, according to the available data) and Abstracts Views on Vision4Press platform.
Data correspond to usage on the plateform after 2015. The current usage metrics is available 48-96 hours after online publication and is updated daily on week days.
Initial download of the metrics may take a while.