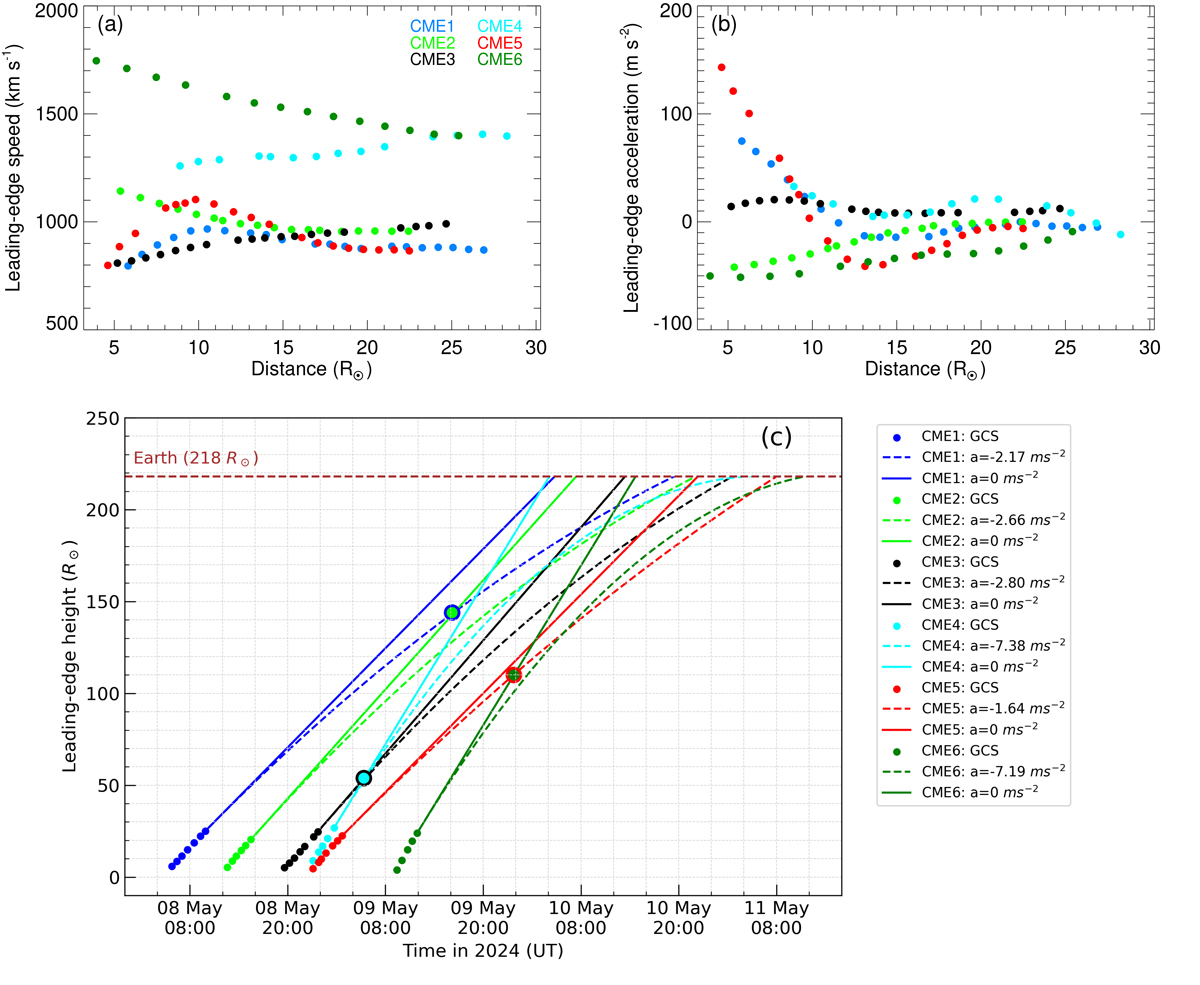
Fig. 2.
Download original image
Propagation speed (a) and acceleration (b) of LE of the selected CMEs derived from the GCS-model-fitted 3D LE heights. (c) Height-time profiles of the CMEs assuming no acceleration (solid line) and some value of a constant average deceleration (dashed line). The color-filled circles indicate the first possible CME-CME interaction height. The initial dots show the GCS-fitted heights for the CMEs. We include only every other data point for the GCS-fitted heights for the sake of clarity.
Current usage metrics show cumulative count of Article Views (full-text article views including HTML views, PDF and ePub downloads, according to the available data) and Abstracts Views on Vision4Press platform.
Data correspond to usage on the plateform after 2015. The current usage metrics is available 48-96 hours after online publication and is updated daily on week days.
Initial download of the metrics may take a while.