Fig. 7.
Download original image
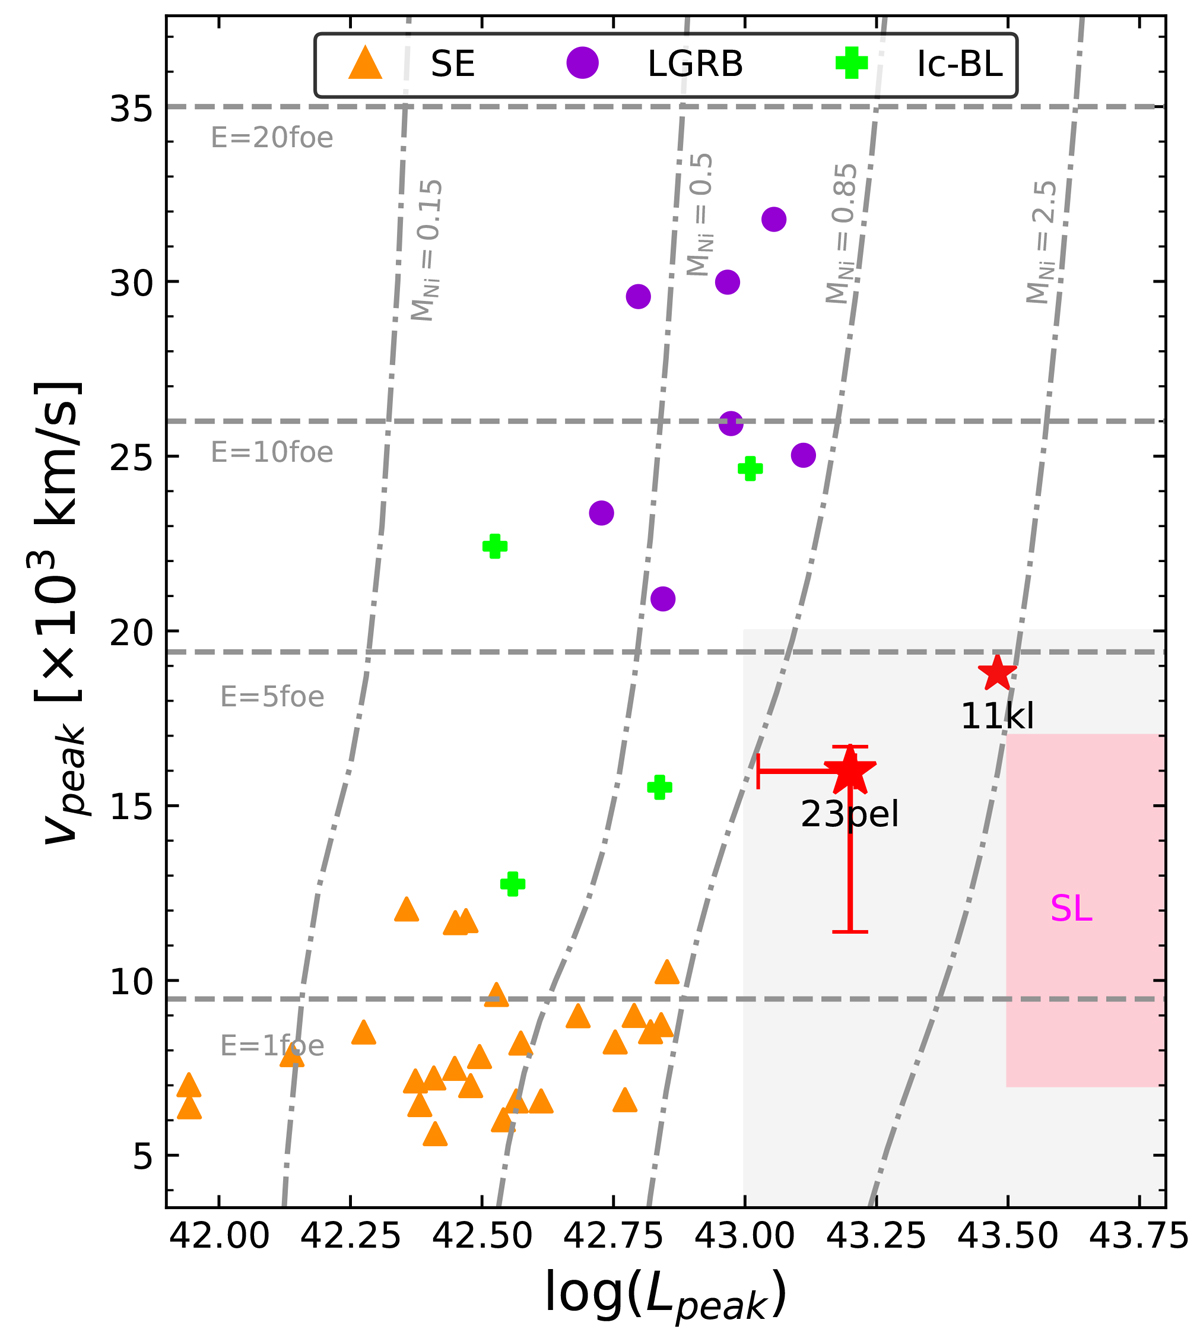
Lpeak vs. vpeak plane. SN 2023pel and SN 2011kl are marked by red stars. A sample of 7 GRB-SNe (Saez et al. in prep.; purple dots), 31 SESNe (Taddia et al. 2018, orange triangles), and 4 SNe classified as Ic-BL but not associated with GRBs (Román Aguilar & Bersten 2023; Taddia et al. 2018, green crosses) are included for comparison. The pink region indicates the expected location of SLSNe. The gray area indicates a region of high luminosities (Lpeak) and low vpeak where Ni models require MNi ≳ 0.85 M⊙. We also show Ni models with fixed energy but varying MNi (dashed lines), and fixed MNi but varying E (dot-dashed lines), for an ejecta mass of 3.4 M⊙.
Current usage metrics show cumulative count of Article Views (full-text article views including HTML views, PDF and ePub downloads, according to the available data) and Abstracts Views on Vision4Press platform.
Data correspond to usage on the plateform after 2015. The current usage metrics is available 48-96 hours after online publication and is updated daily on week days.
Initial download of the metrics may take a while.