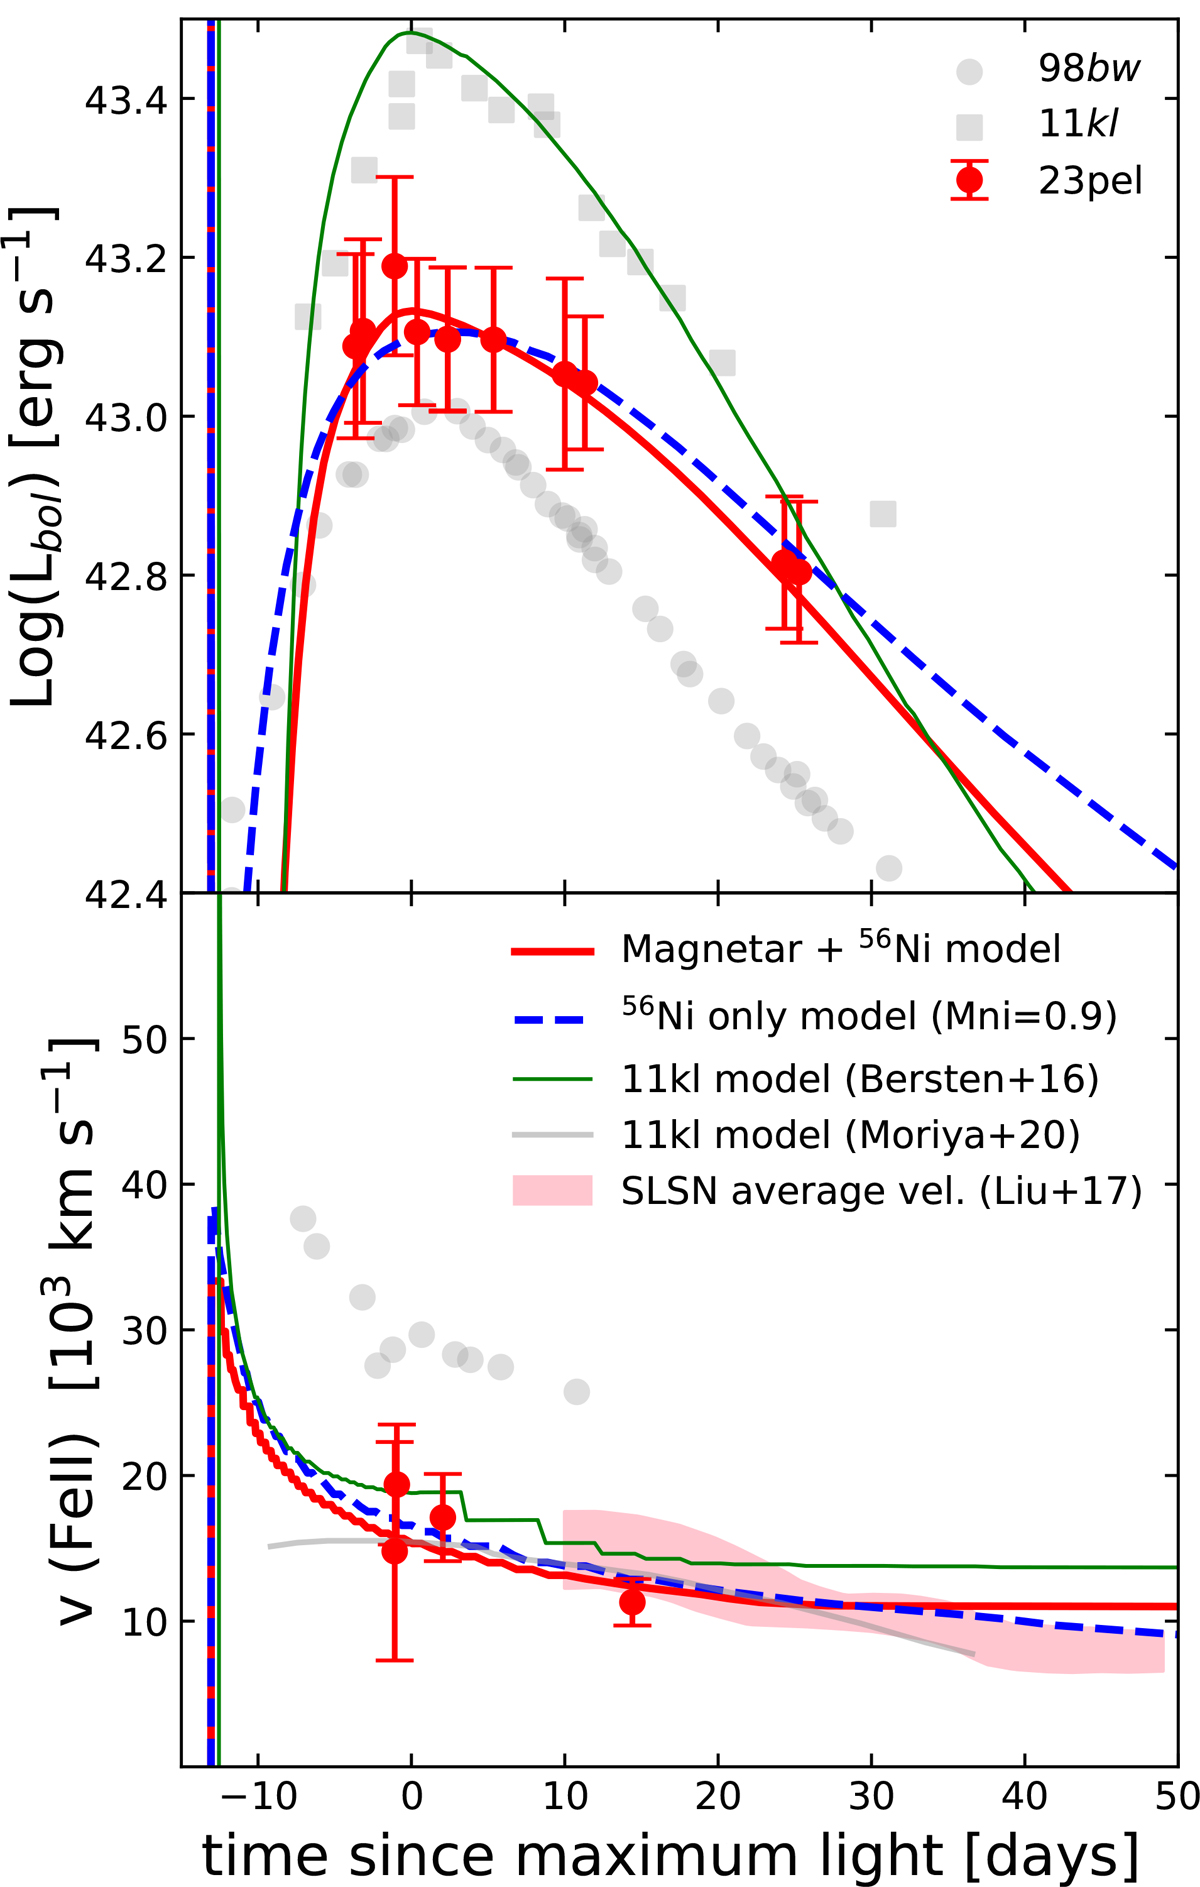
Fig. 6.
Download original image
Comparison between observations and models. Top panel: bolometric LCs. Bottom panel: photospheric and line velocities evolution. Time is shown in days since maximum bolometric luminosity. The solid red line represents our preferred model for SN 2023pel, associated with the lowest χ2, driven by a magnetar with P = 3.2 ms, B = 28 × 1014 G, and MNi = 0.24 M⊙ (see Sect. 4 for more parameter details). The dashed blue line represents the Ni model, with MNi = 0.9 M⊙. Solid green and gray lines represent models for SN 2011kl calculated by Bersten et al. (2016) and Moriya et al. (2020), respectively. The shaded area denotes the weighted average velocities of SLSNe Ic (pink) calculated by Liu et al. (2017). Observations of SN 1998bw (Clocchiatti et al. 2011) and SN 2011kl (Greiner et al. 2015) are included for comparison.
Current usage metrics show cumulative count of Article Views (full-text article views including HTML views, PDF and ePub downloads, according to the available data) and Abstracts Views on Vision4Press platform.
Data correspond to usage on the plateform after 2015. The current usage metrics is available 48-96 hours after online publication and is updated daily on week days.
Initial download of the metrics may take a while.