Fig. 1.
Download original image
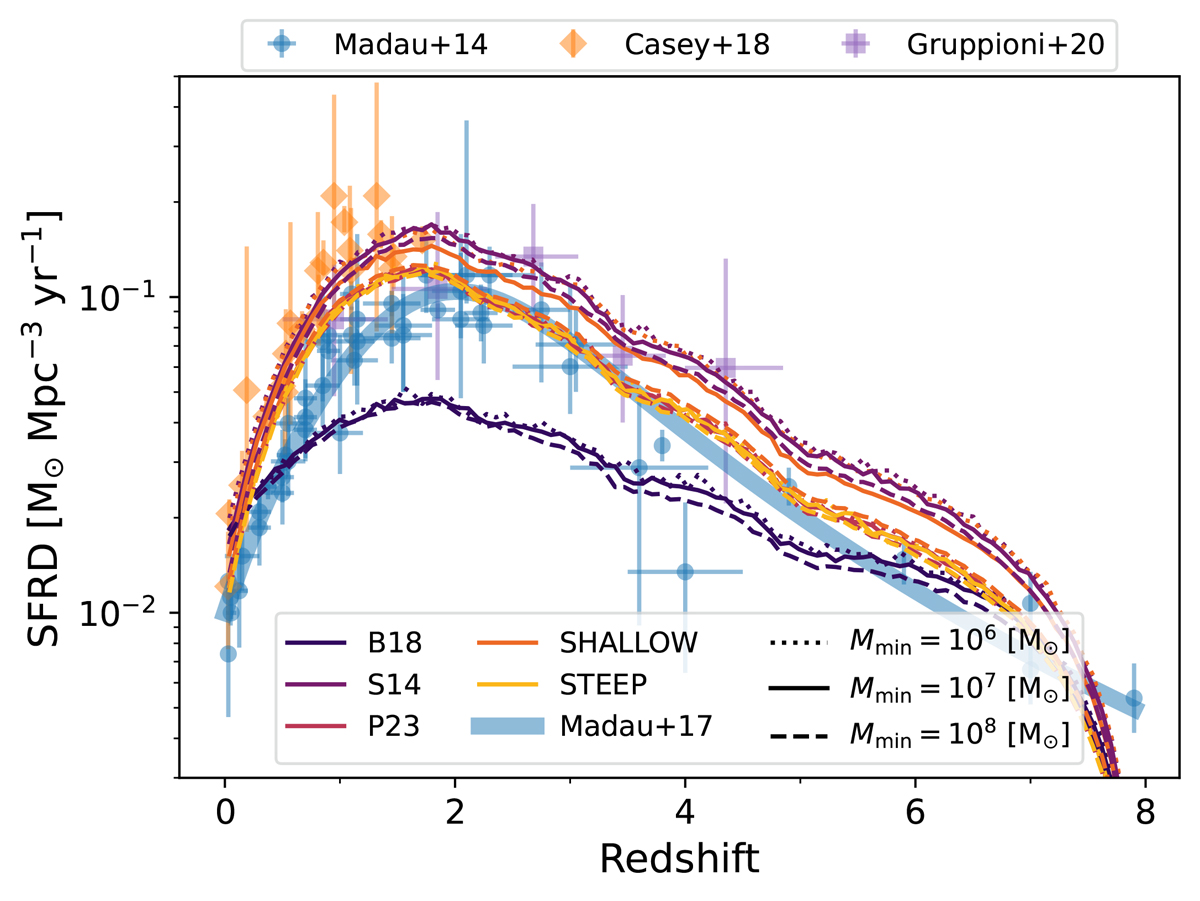
SFR density as a function of redshift for different SFR–M* relations (different colors). The different linestyles show the results by cutting the galaxy main sequence at different minimum galaxy masses, Mmin = 106 M⊙ (dotted), 107 M⊙ (solid) and 108 M⊙ (dashed). The wide blue line shows the fit by Madau & Fragos (2017). The markers show observed data points: the blue dots are are taken from Madau & Dickinson (2014), the orange diamonds are from Casey et al. (2018), and the purple squares are taken from Gruppioni et al. (2020).
Current usage metrics show cumulative count of Article Views (full-text article views including HTML views, PDF and ePub downloads, according to the available data) and Abstracts Views on Vision4Press platform.
Data correspond to usage on the plateform after 2015. The current usage metrics is available 48-96 hours after online publication and is updated daily on week days.
Initial download of the metrics may take a while.