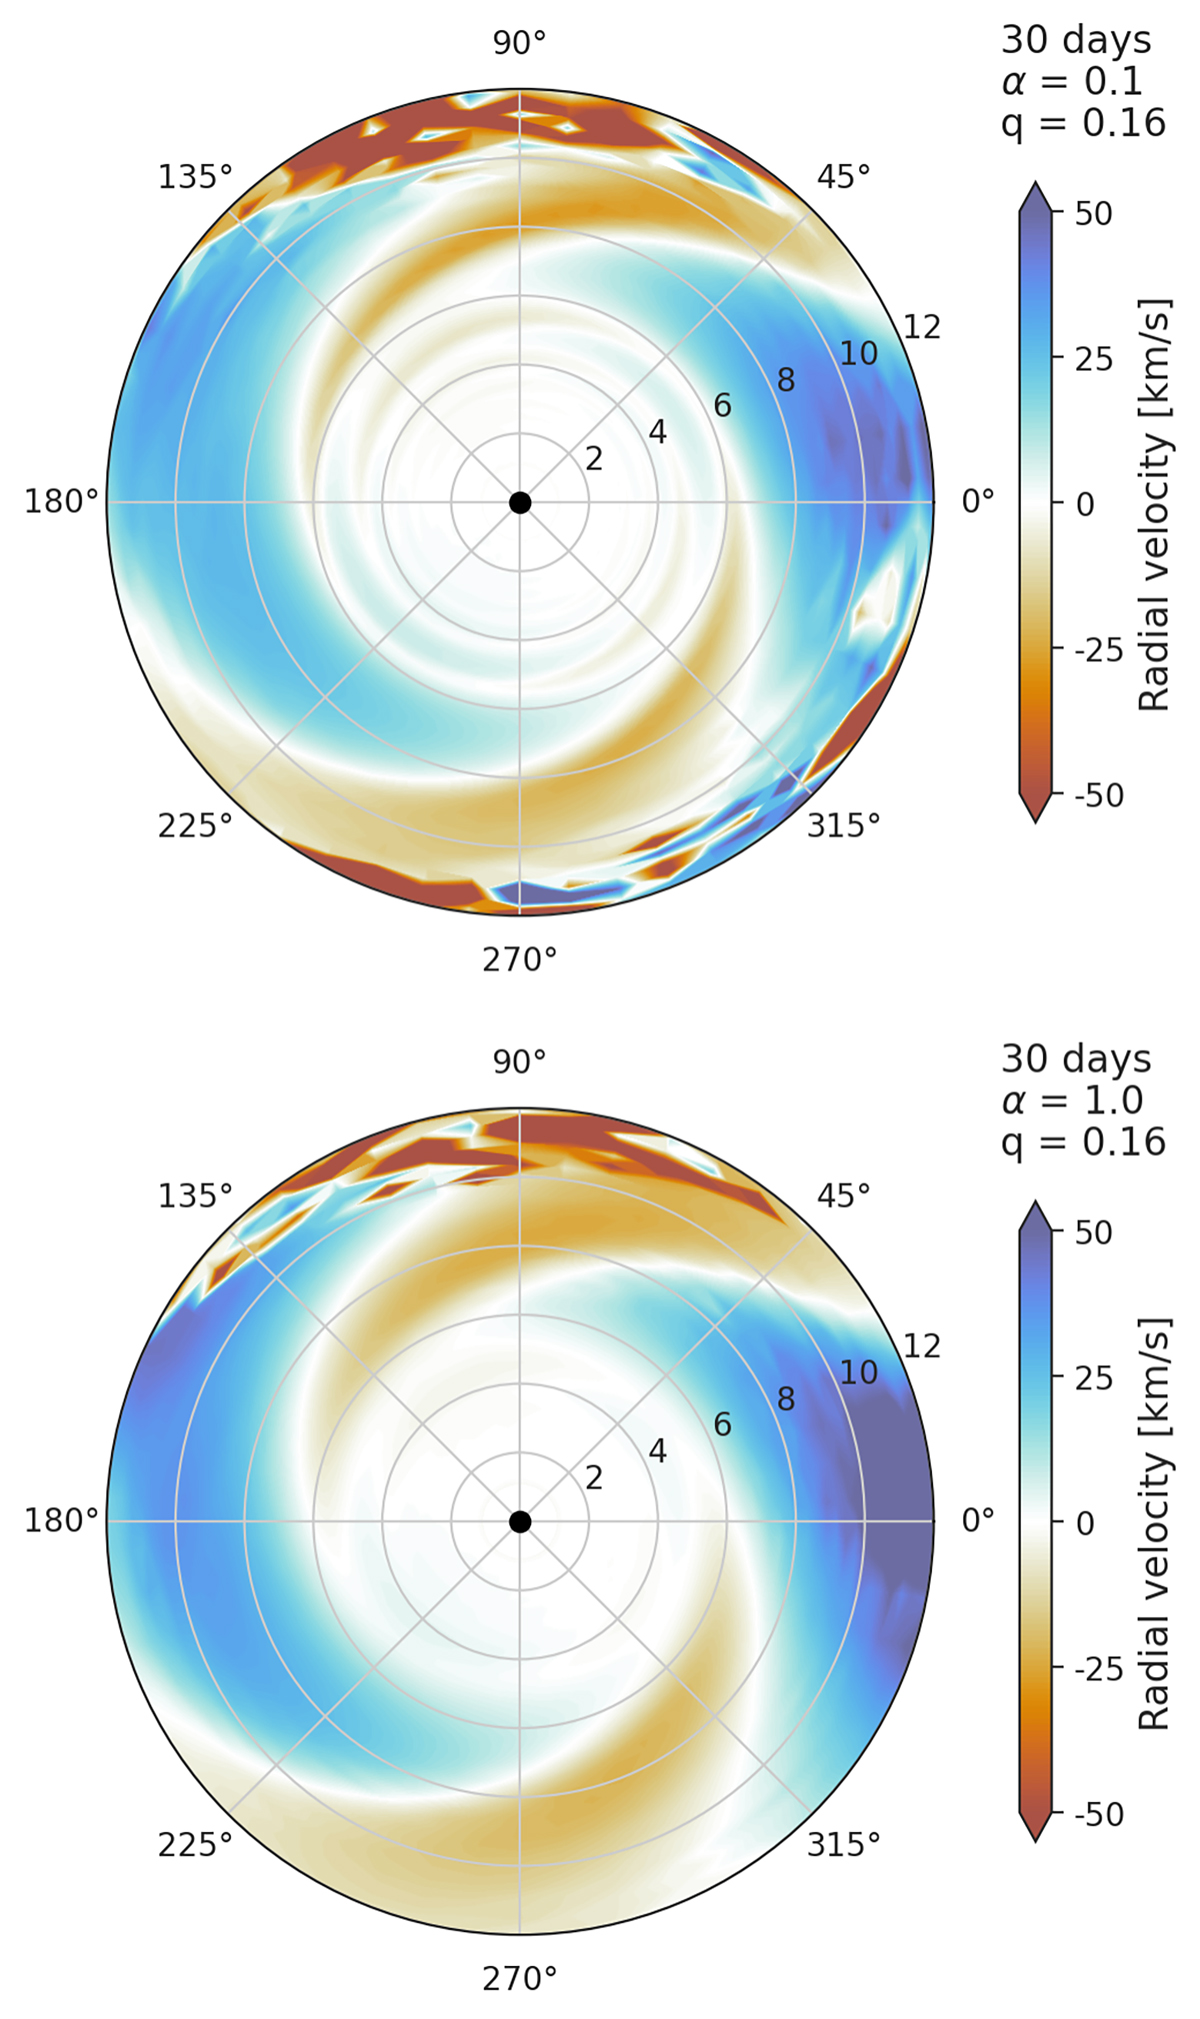
Fig. 4.
Download original image
Radial velocity maps for models 30-0.1-0.16 and 30-1.0-0.16. The black dot in the center represents the central Be star. The double spiral structure formed by the elongation of the orbits of the particles is visible in both maps. The over-density occurs in the apastron of the orbits of the particles, where the particles slow down.
Current usage metrics show cumulative count of Article Views (full-text article views including HTML views, PDF and ePub downloads, according to the available data) and Abstracts Views on Vision4Press platform.
Data correspond to usage on the plateform after 2015. The current usage metrics is available 48-96 hours after online publication and is updated daily on week days.
Initial download of the metrics may take a while.