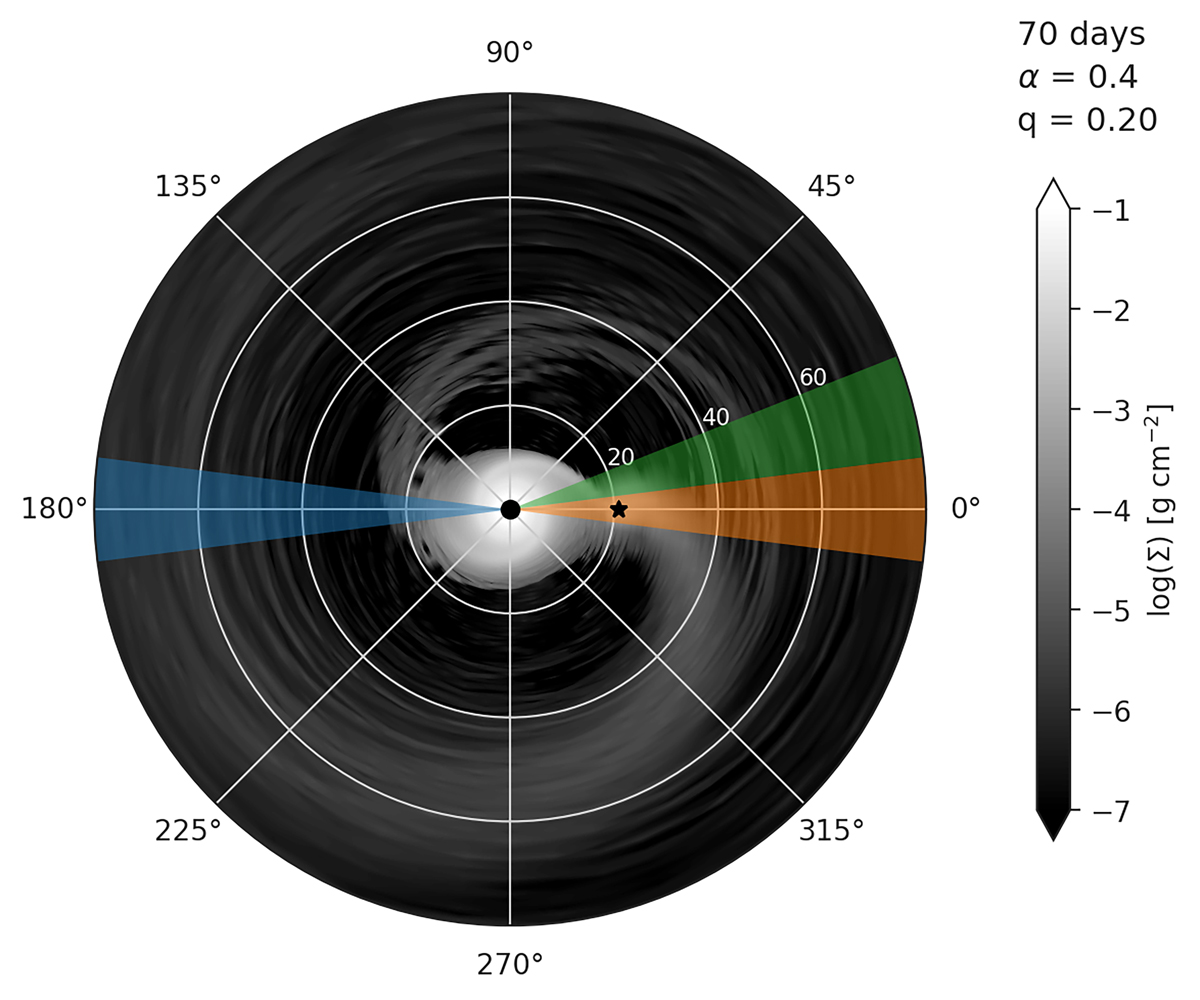
Fig. 2.
Download original image
Surface density map of simulation 0.05-on. The overall density structure is qualitatively similar for all simulations calculated for this work, as sketched in Fig. 3. The black circle denotes the Be star, and the black star, the companion. The white circles and numbers mark the radial distance in Req. The three colored bands correspond to the main regions of interest: the wedge that contains the secondary (yellow), the wedge opposite to the secondary (blue), and a wedge that includes the bridge (green).
Current usage metrics show cumulative count of Article Views (full-text article views including HTML views, PDF and ePub downloads, according to the available data) and Abstracts Views on Vision4Press platform.
Data correspond to usage on the plateform after 2015. The current usage metrics is available 48-96 hours after online publication and is updated daily on week days.
Initial download of the metrics may take a while.