Open Access
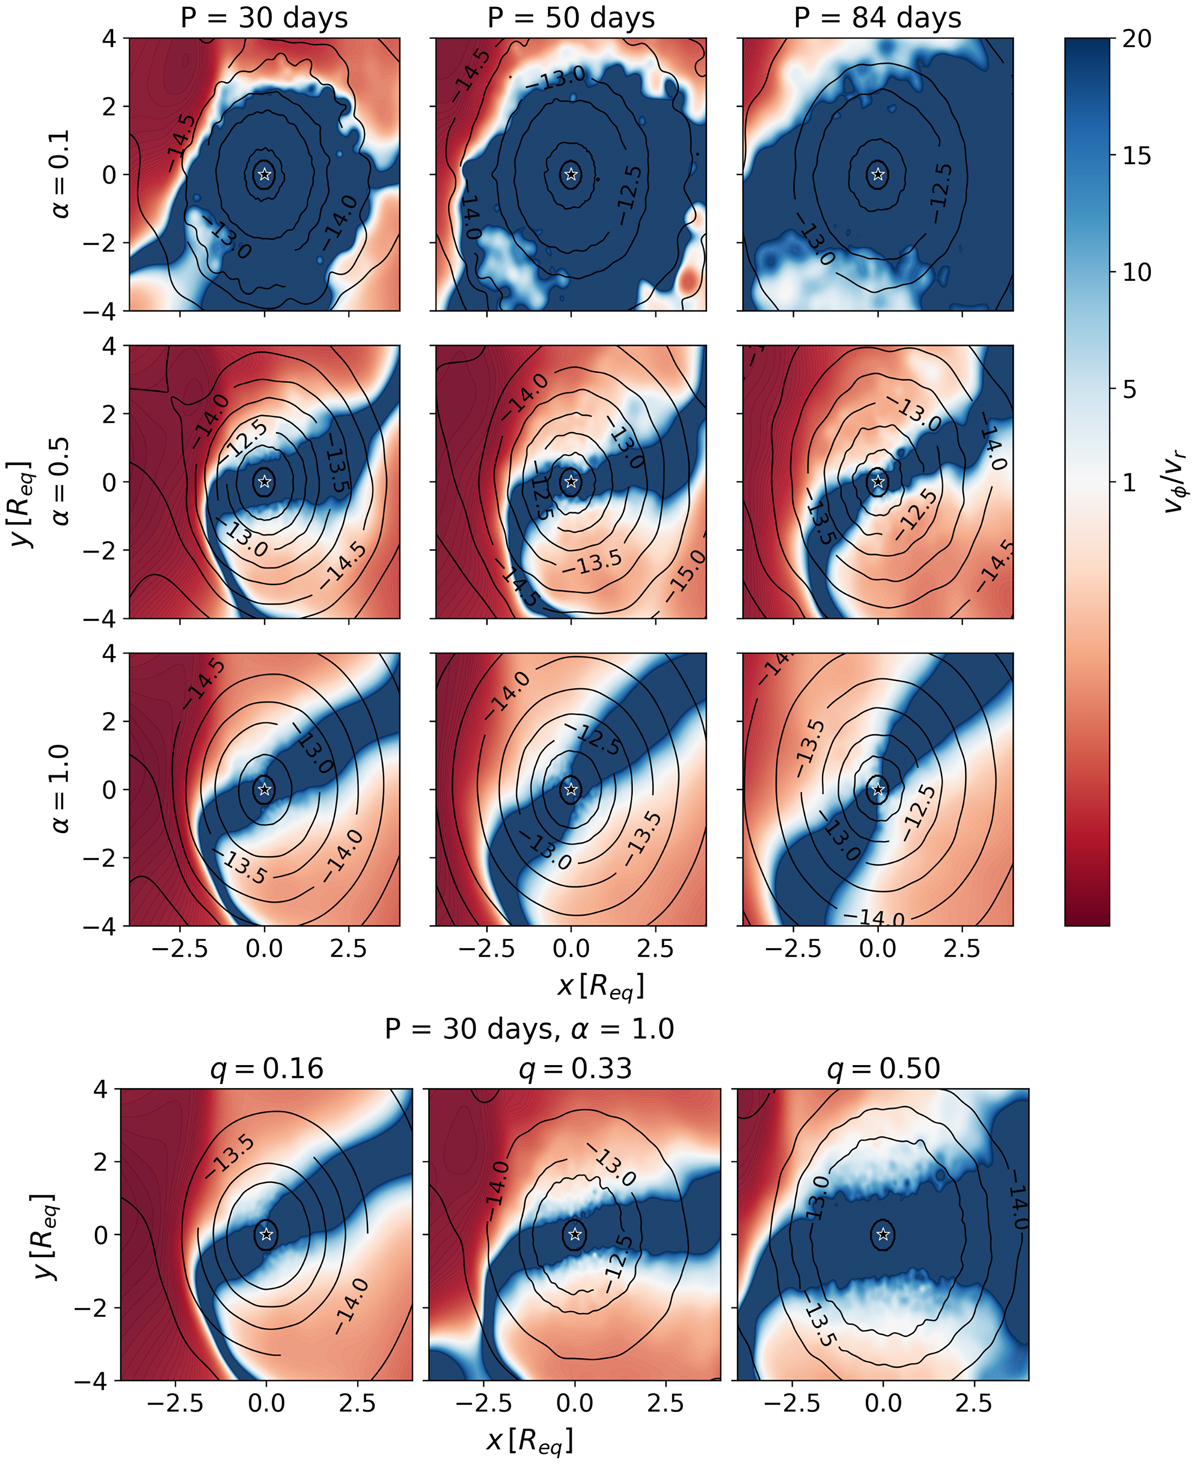
Fig. 11.
Download original image
Map of the ratio of vϕ to vr in the reference frame of the secondary, indicated by a black star in the center. Cross section contour plots (at z = 0) of the volume density (log(ρ), in g cm−3, integrated from z = −10 to 10 Req) of the circumsecondary region are shown in black. The Be star is to the left, not shown.
Current usage metrics show cumulative count of Article Views (full-text article views including HTML views, PDF and ePub downloads, according to the available data) and Abstracts Views on Vision4Press platform.
Data correspond to usage on the plateform after 2015. The current usage metrics is available 48-96 hours after online publication and is updated daily on week days.
Initial download of the metrics may take a while.