Open Access
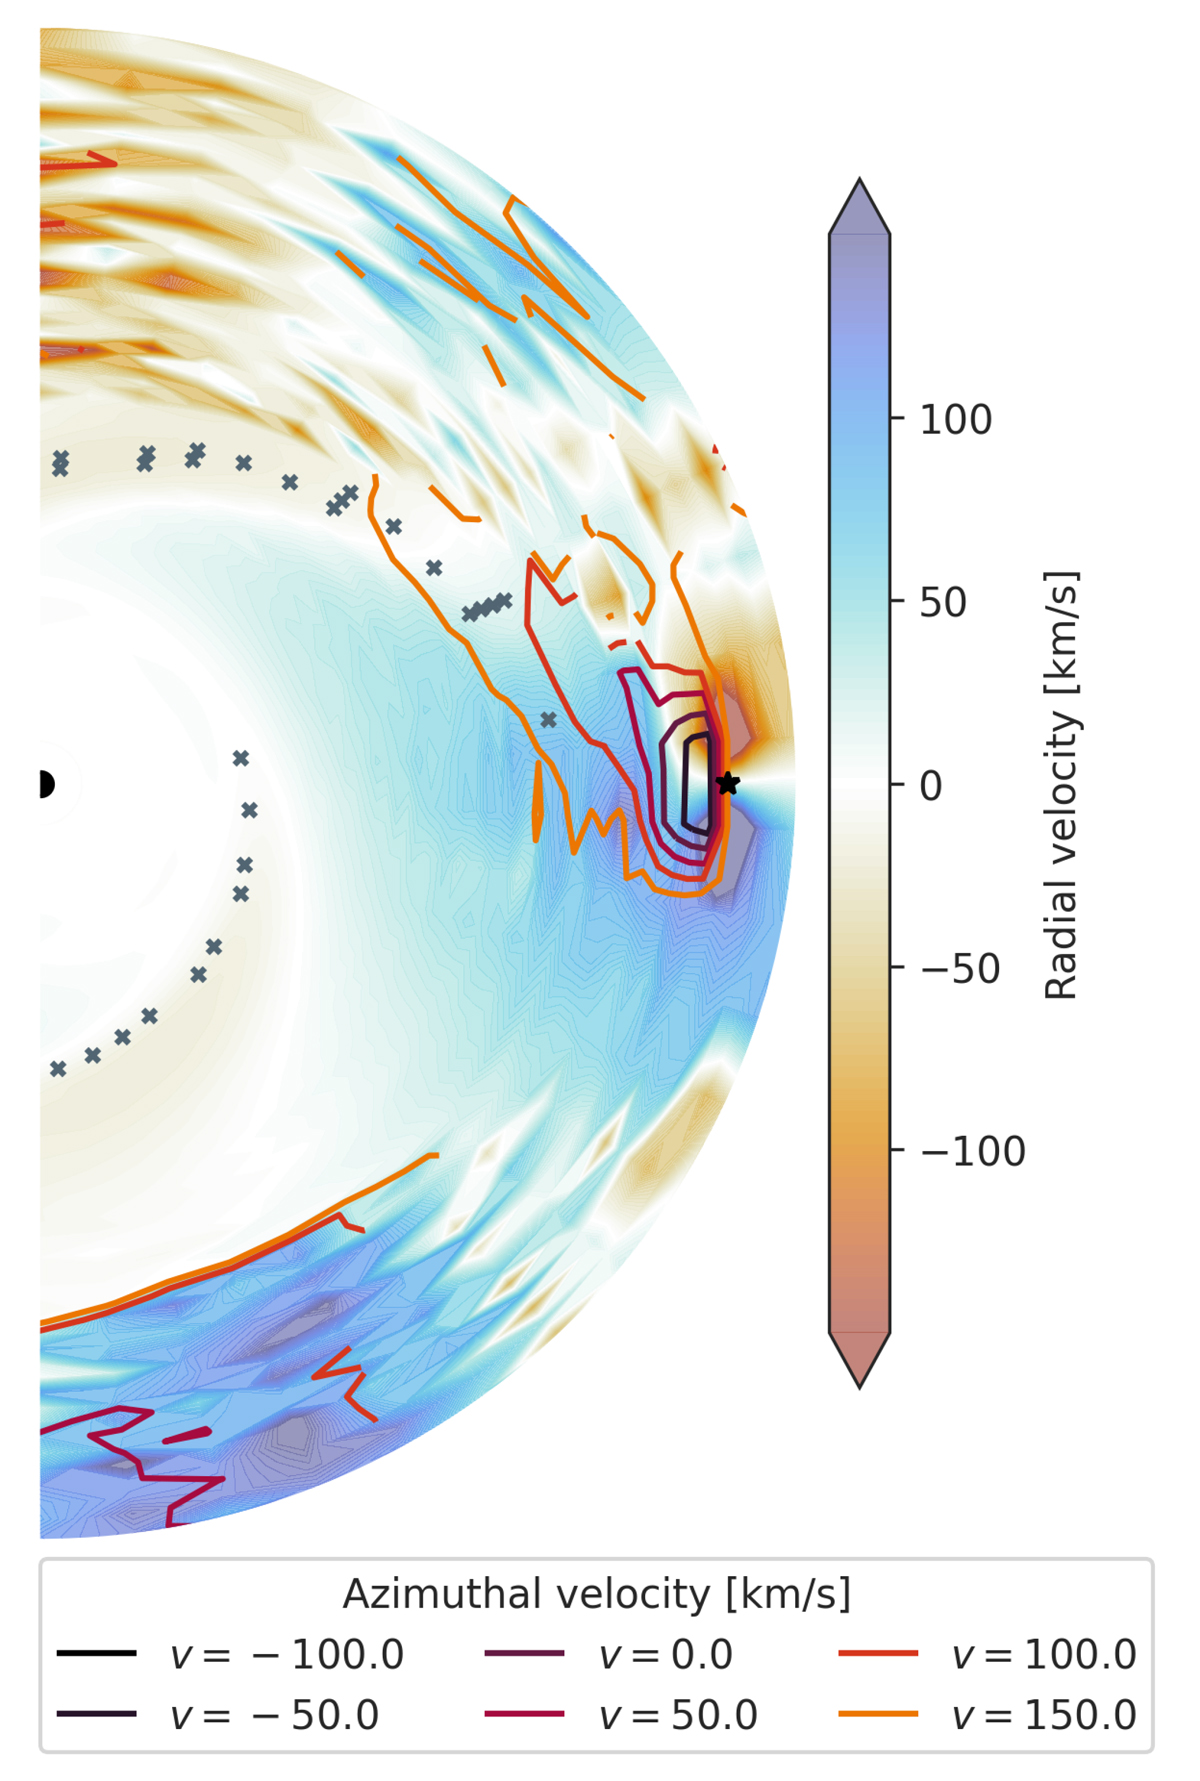
Fig. 10.
Download original image
Map of radial (in full colors) and azimuthal (contours) velocity for simulation 30-1.0-0.16. The gray xs mark the regions of highest density for that given radii, tracking the two spiral arms. The black half circle marks the Be star, and the black star denotes the companion.
Current usage metrics show cumulative count of Article Views (full-text article views including HTML views, PDF and ePub downloads, according to the available data) and Abstracts Views on Vision4Press platform.
Data correspond to usage on the plateform after 2015. The current usage metrics is available 48-96 hours after online publication and is updated daily on week days.
Initial download of the metrics may take a while.