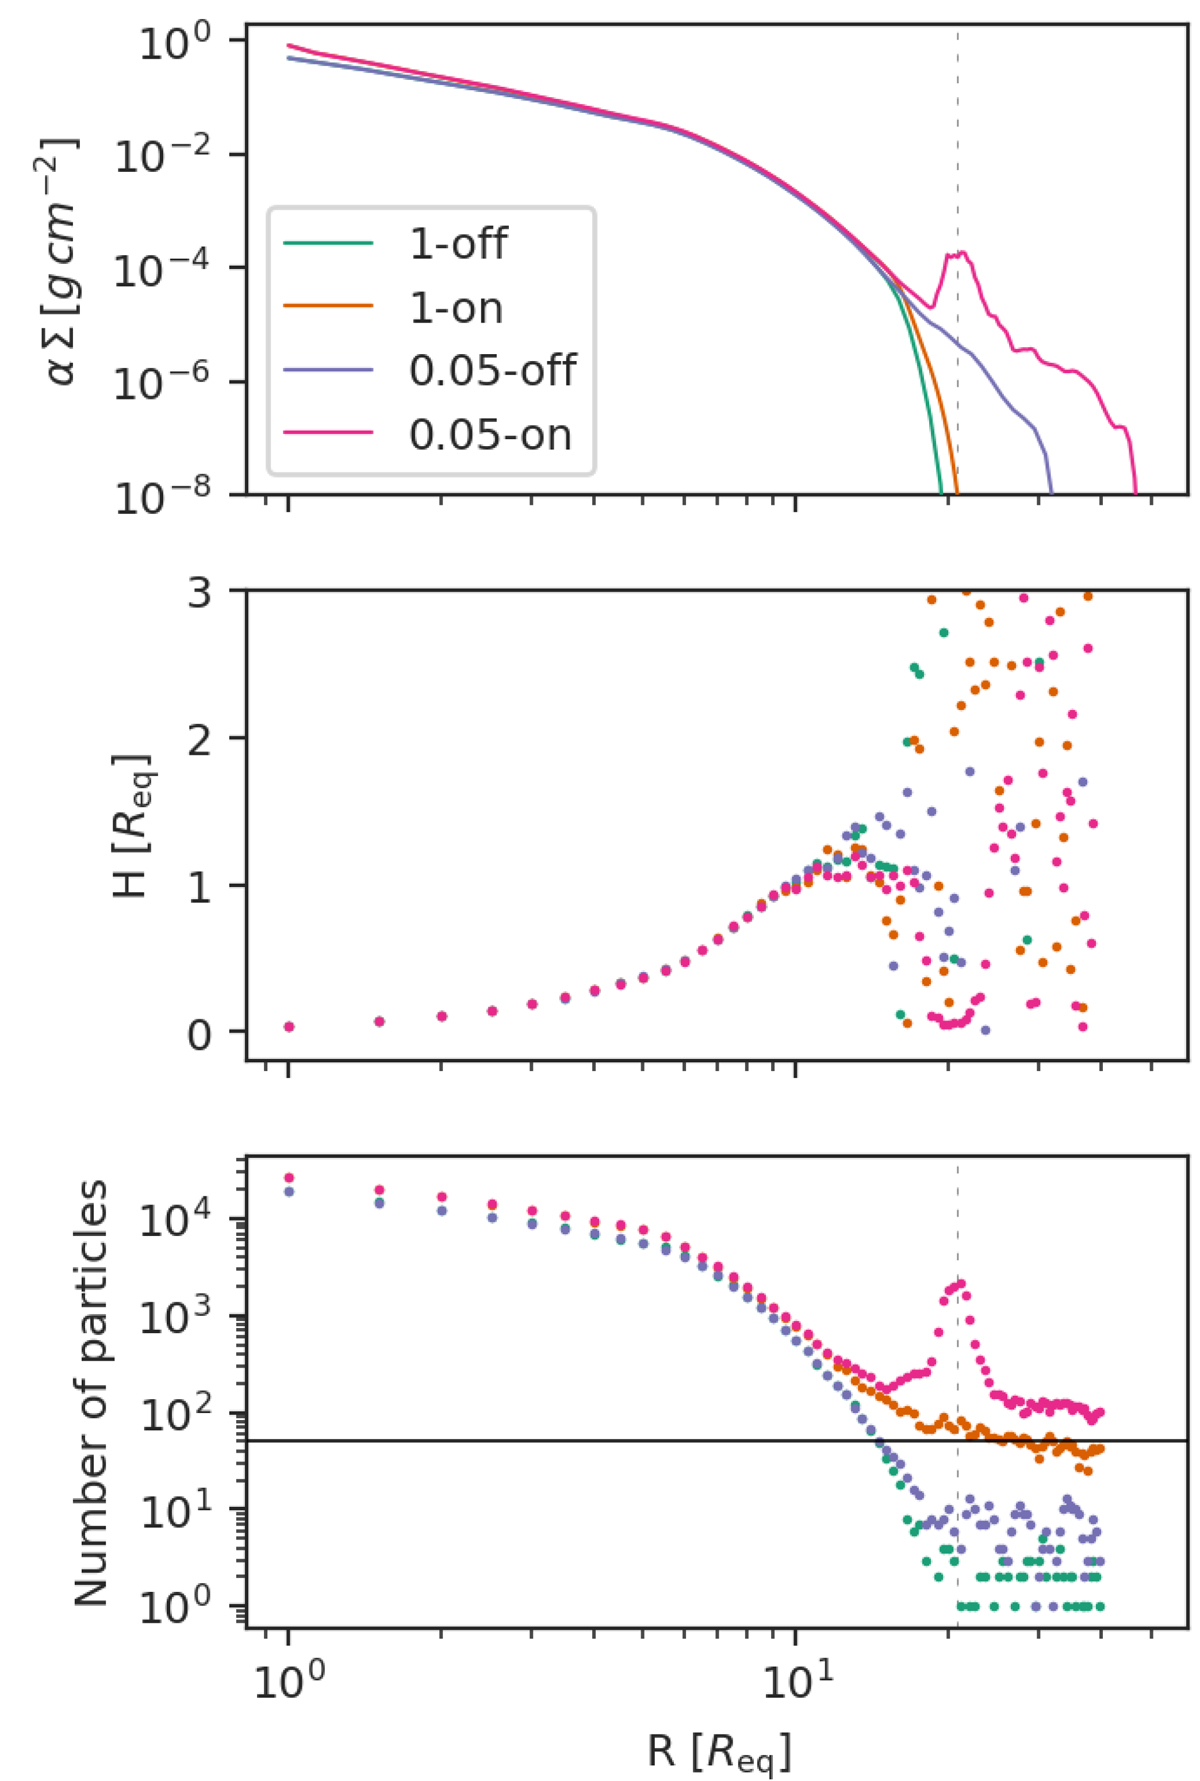
Fig. 1.
Download original image
Comparison of averaged surface density and disk height between the models detailed in Table 1. First panel shows the density normalized by the viscosity parameter; second panel shows the scale height H, and the last panel the number of particles in a given radial extent. The dashed vertical line represents the position of the secondary, which is the same for all simulations. The horizontal line in the bottom panel marks 50 particles.
Current usage metrics show cumulative count of Article Views (full-text article views including HTML views, PDF and ePub downloads, according to the available data) and Abstracts Views on Vision4Press platform.
Data correspond to usage on the plateform after 2015. The current usage metrics is available 48-96 hours after online publication and is updated daily on week days.
Initial download of the metrics may take a while.