Fig. 8.
Download original image
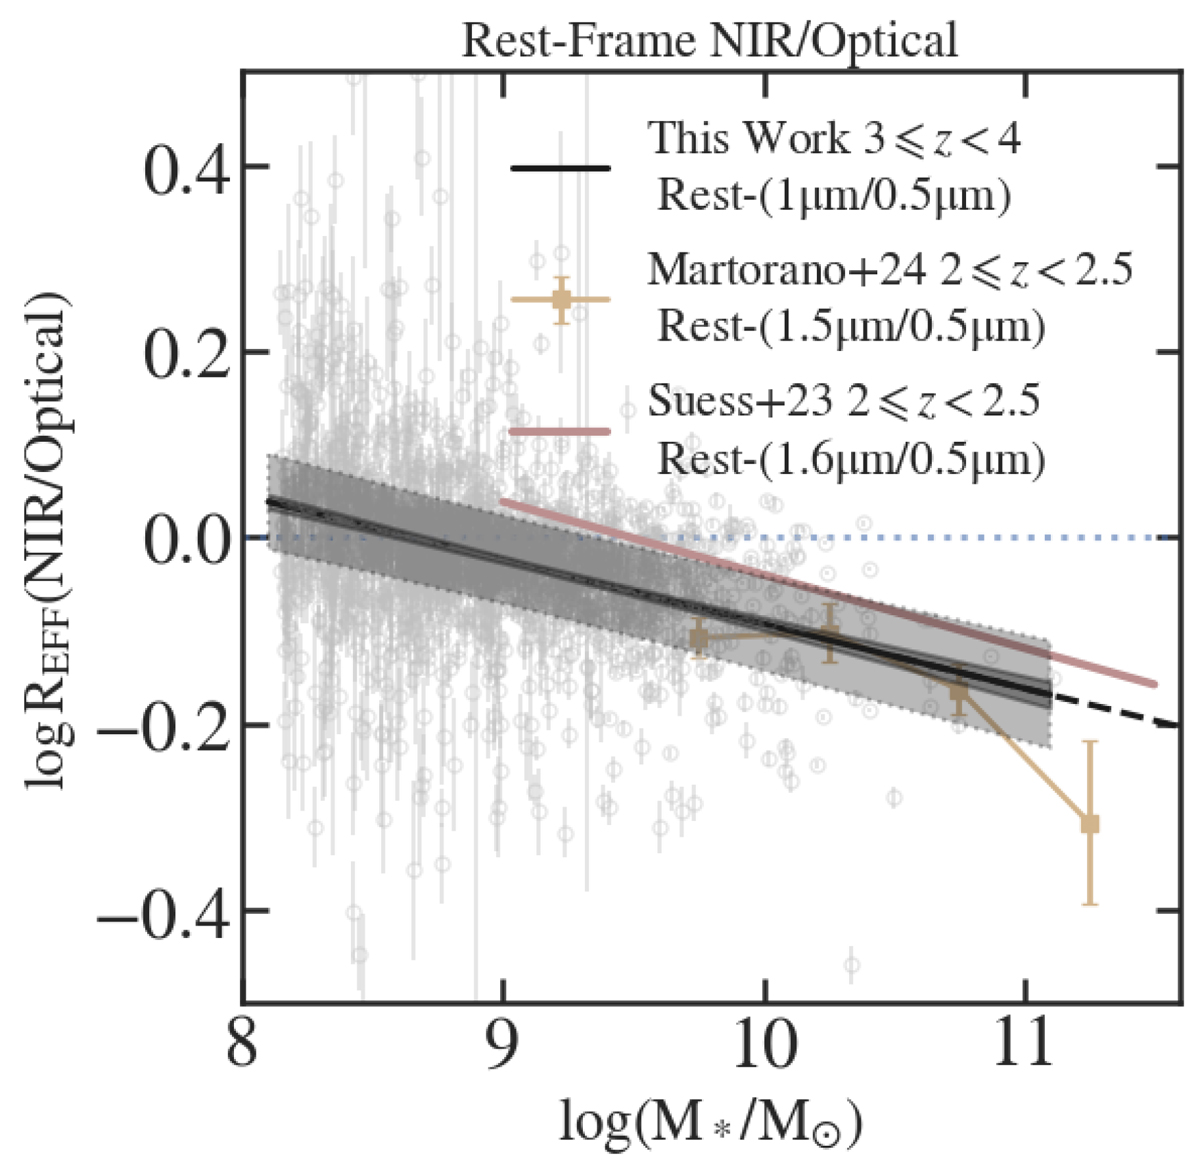
Ratio of size–mass relations in F444W and F200W at 3 ≤ z < 4: the black line represents rest-frame ∼1 μm and ∼0.5 μm with dashed segments extrapolating to log(M*/M⊙) > 11. JWST-based results from Suess et al. (2022) and Martorano et al. (2024) are shown as coloured solid lines and squared points. Star-forming galaxies at log(M*/M⊙) > 9.5 are ≳10% smaller in rest-1 μm than in rest-0.5 μm consistent of colour-gradients (see Section 5.3) and lower-z studies.
Current usage metrics show cumulative count of Article Views (full-text article views including HTML views, PDF and ePub downloads, according to the available data) and Abstracts Views on Vision4Press platform.
Data correspond to usage on the plateform after 2015. The current usage metrics is available 48-96 hours after online publication and is updated daily on week days.
Initial download of the metrics may take a while.