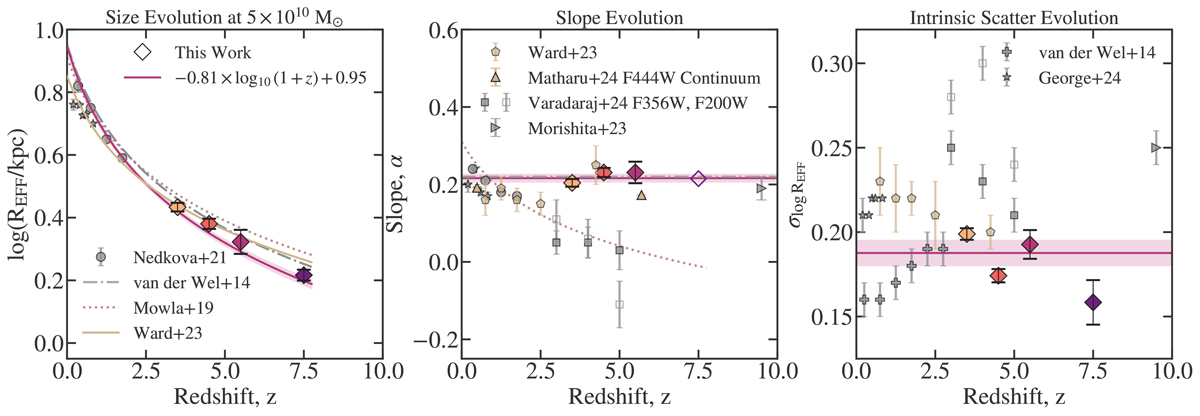
Fig. 5.
Download original image
Redshift evolution of the best-fit star-forming, rest-optical size–mass relation parameters. Left panel: Size evolution for galaxies at a fixed stellar mass of M* = 5 × 10¹⁰ M⊙ in the range 0.35 ≤ z < 9. Centre panel: Evolution of the slope, α. Right panel: evolution in the intrinsic scatter, σlogREFF. The diamonds and solid pink lines show the measurements and parametrised evolution from this paper. The HST-based measurements (Nedkova et al. 2021; Mowla et al. 2019; George et al. 2024; van der Wel et al. 2012) are shown in grey. The JWST-based studies from Ward et al. (2024) and Matharu et al. (2024) are shown in tan. The JWST-based work based on UV-bright ground-based selected star-forming galaxies from Varadaraj et al. (2024) are shown as grey squares. The HST-based parametrised fits to the redshift evolution from Mowla et al. (2019) and van der Wel et al. (2012) as well as the JWST-based size-evolution from Ward et al. (2024) are also included (see Table A.1 for values).
Current usage metrics show cumulative count of Article Views (full-text article views including HTML views, PDF and ePub downloads, according to the available data) and Abstracts Views on Vision4Press platform.
Data correspond to usage on the plateform after 2015. The current usage metrics is available 48-96 hours after online publication and is updated daily on week days.
Initial download of the metrics may take a while.