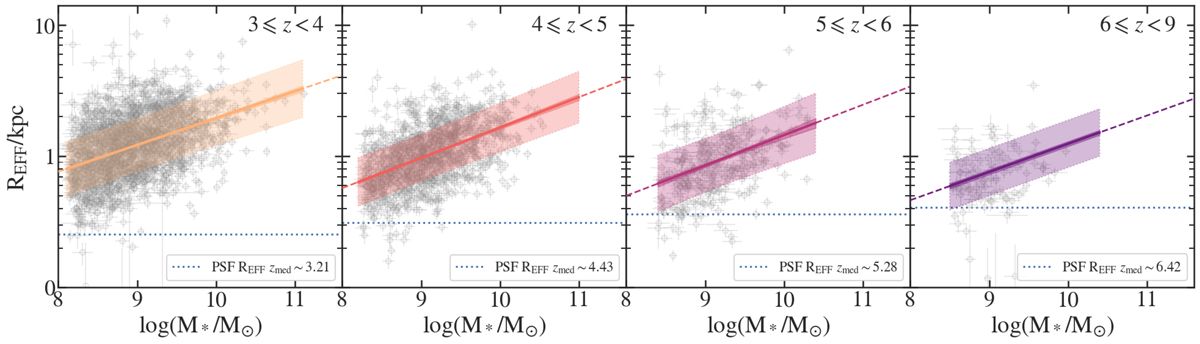
Fig. 3.
Download original image
Rest-optical size–mass relation across four redshift bins: 3 ≤ z < 4, 4 ≤ z < 5, 5 ≤ z < 6 and 6 ≤ z < 9. The solid black line represents the median fit, with its uncertainty in dark shading and intrinsic scatter in light grey. The grey open circles mark the data points used in the fit. The dotted line indicates the PSF size at the bin’s median redshift; points below this threshold REFF were excluded from fitting. In the highest redshift bin, due to limited data, we fixed the slope and fitted only the intercept and intrinsic dispersion (see Section 3.4).
Current usage metrics show cumulative count of Article Views (full-text article views including HTML views, PDF and ePub downloads, according to the available data) and Abstracts Views on Vision4Press platform.
Data correspond to usage on the plateform after 2015. The current usage metrics is available 48-96 hours after online publication and is updated daily on week days.
Initial download of the metrics may take a while.