Fig. 4
Download original image
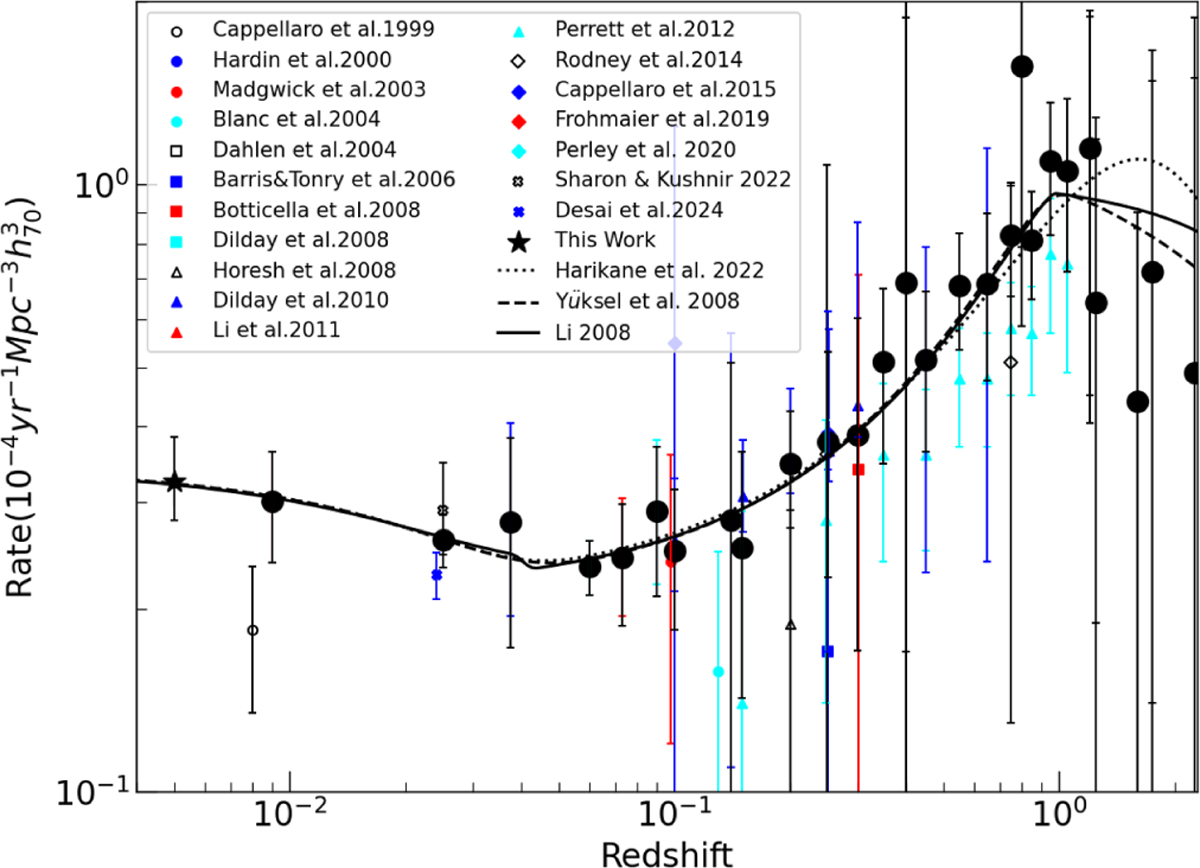
Supernova rates derived using different SFH models and best-fit parameters of the two-component model. The dashed, solid, and dotted lines correspond to the SFH given by Yüksel et al. (2008), Li (2008) and Harikane et al. (2022), respectively. The black dots represent the binned rate measurements used in our DTD fitting procedure.
Current usage metrics show cumulative count of Article Views (full-text article views including HTML views, PDF and ePub downloads, according to the available data) and Abstracts Views on Vision4Press platform.
Data correspond to usage on the plateform after 2015. The current usage metrics is available 48-96 hours after online publication and is updated daily on week days.
Initial download of the metrics may take a while.