Fig. 2
Download original image
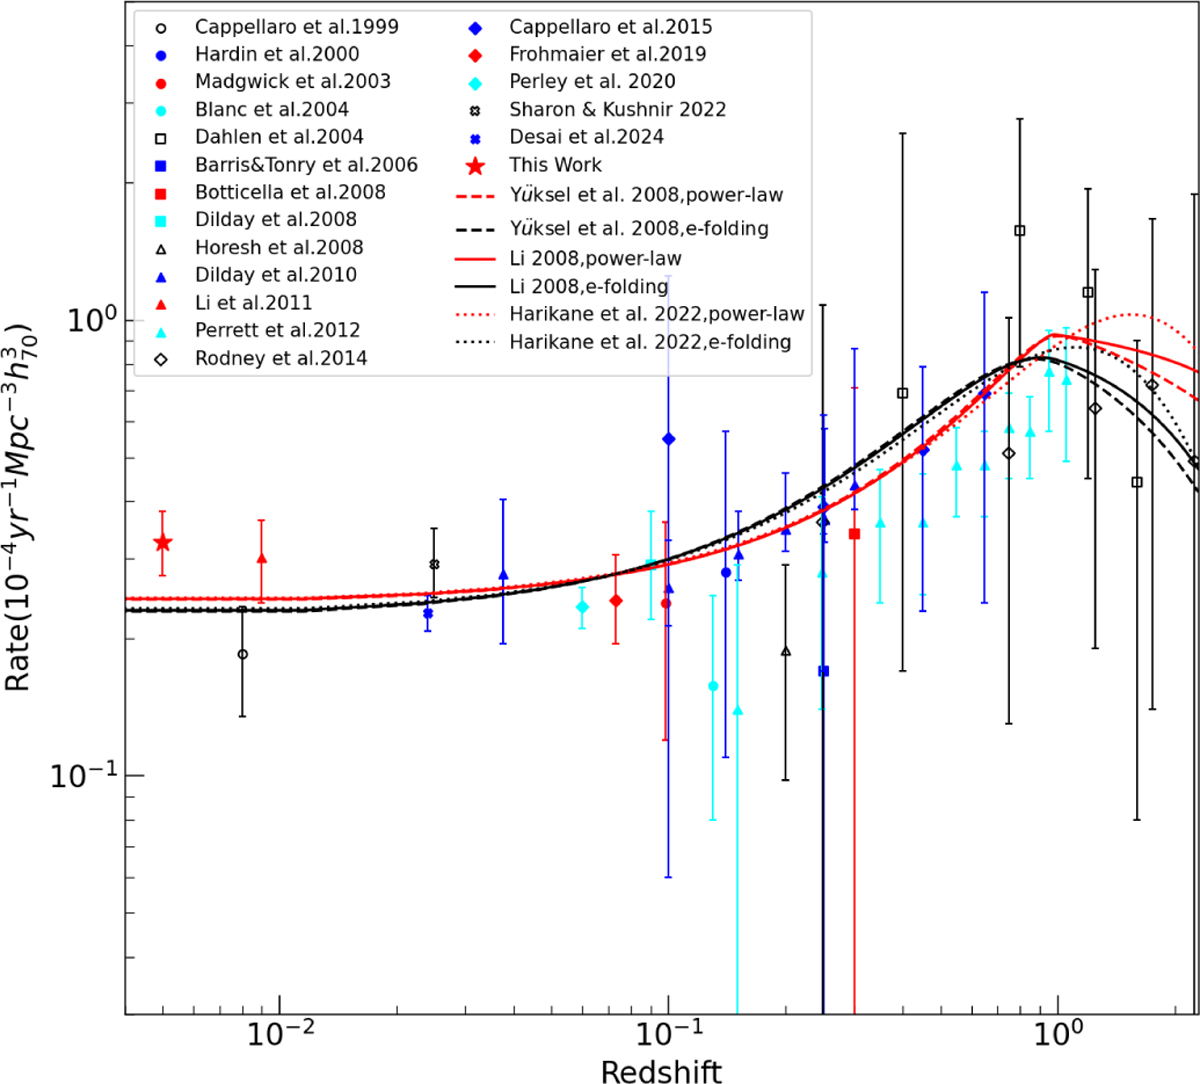
Volumetric SN Ia rates compared to historical measurements at different redshifts. Red and black lines denote the SN Ia rates derived from power-law and e-folding forms of the DTD, respectively. The dashed, solid, and dotted lines illustrates the SN Ia rates derived from SFH given by Yüksel et al. (2008), Li (2008), and Harikane et al. (2022), respectively.
Current usage metrics show cumulative count of Article Views (full-text article views including HTML views, PDF and ePub downloads, according to the available data) and Abstracts Views on Vision4Press platform.
Data correspond to usage on the plateform after 2015. The current usage metrics is available 48-96 hours after online publication and is updated daily on week days.
Initial download of the metrics may take a while.