Fig. 4.
Download original image
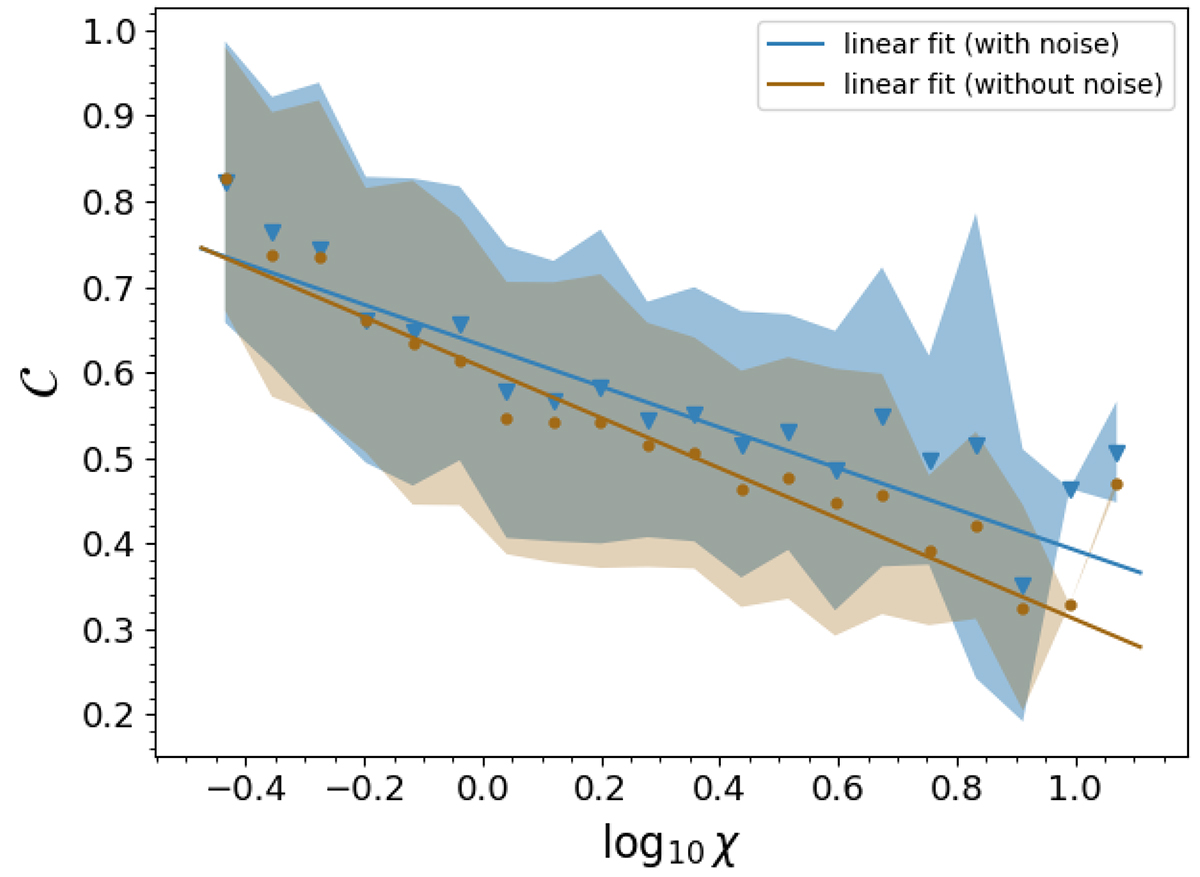
𝒞 versus log10χ. In blue, the results for the 𝒞 parameter computed on the mock Planck-like y-maps. In orange, the results for the 𝒞no_noise parameter computed on the mock y-maps generated without noise contamination (see Section 2.2.1). The blue triangles and the orange points are the mean values of 𝒞 and 𝒞no_noise, respectively, in each bin of log10χ. The shaded areas are at ±1σ. The solid blue line is the best linear fit of equation 𝒞 = (−0.24 ± 0.02) log10χ + (0.63 ± 0.01). The solid orange line is the best linear fit of equation 𝒞no_noise = (−0.29 ± 0.02) log10χ + (0.61 ± 0.01).
Current usage metrics show cumulative count of Article Views (full-text article views including HTML views, PDF and ePub downloads, according to the available data) and Abstracts Views on Vision4Press platform.
Data correspond to usage on the plateform after 2015. The current usage metrics is available 48-96 hours after online publication and is updated daily on week days.
Initial download of the metrics may take a while.