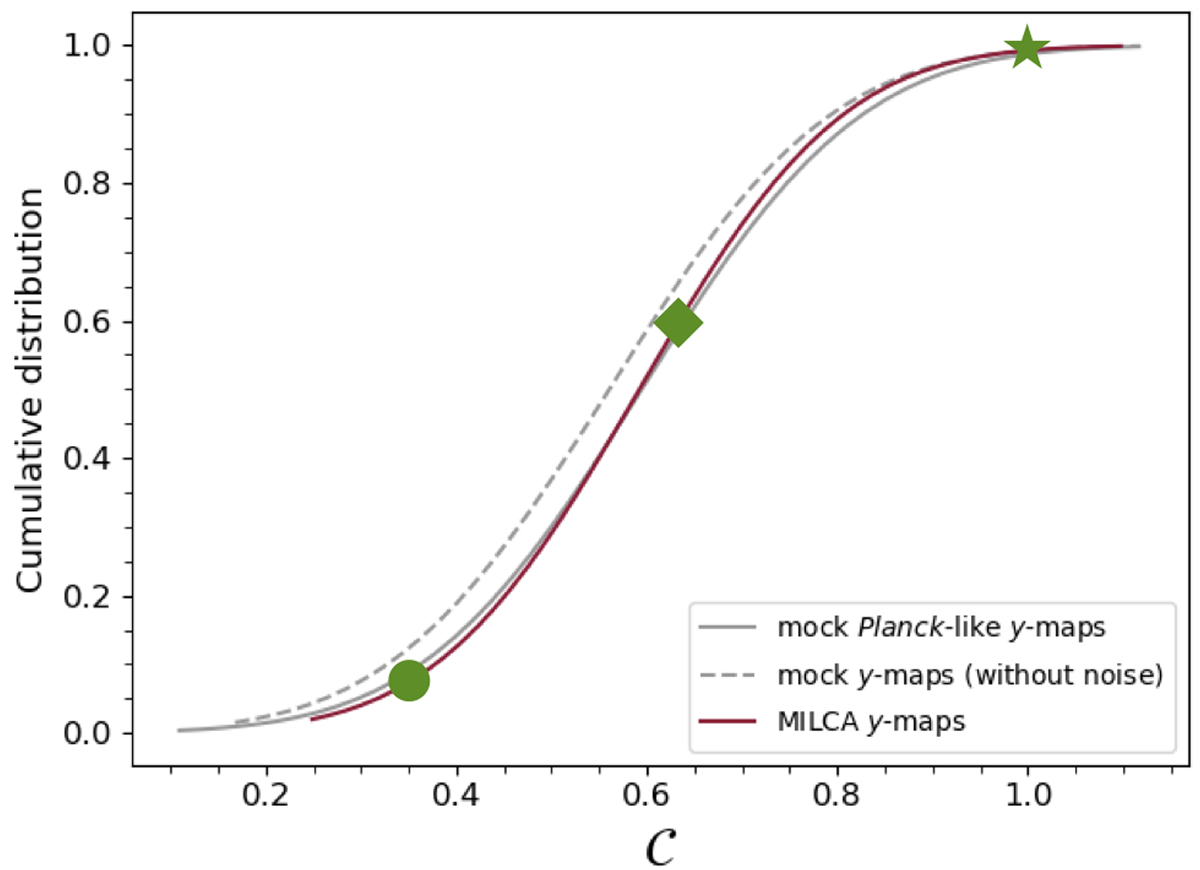
Fig. 3.
Download original image
Cumulative distribution of the number of clusters along the 𝒞 parameter. The red line refers to the PSZ2_cosmo sample, the grey lines refer to the sample selected from THE300, and considering, respectively, their Planck-like maps (solid line) and their maps without noise (dashed line). The green markers are used to indicate the value of 𝒞 for the three maps shown in Fig. 2.
Current usage metrics show cumulative count of Article Views (full-text article views including HTML views, PDF and ePub downloads, according to the available data) and Abstracts Views on Vision4Press platform.
Data correspond to usage on the plateform after 2015. The current usage metrics is available 48-96 hours after online publication and is updated daily on week days.
Initial download of the metrics may take a while.