Fig. 2.
Download original image
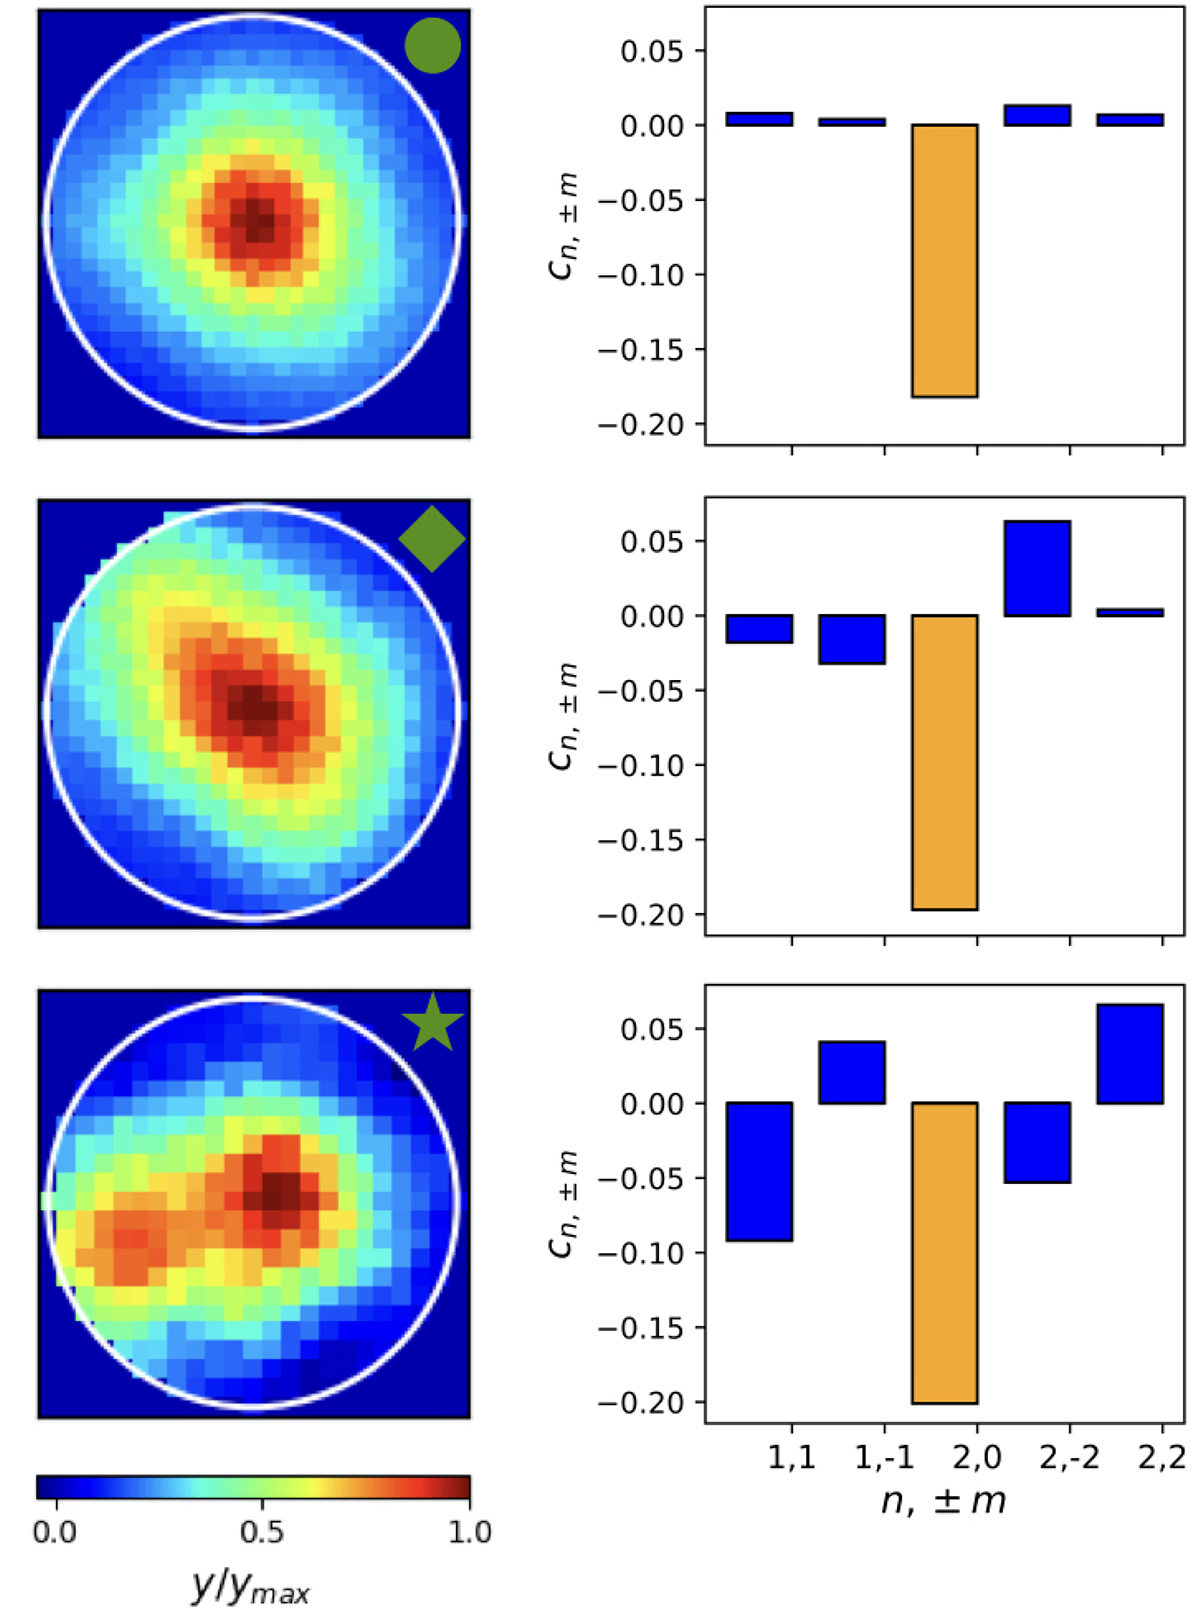
Left: Examples of Planck y-maps of three clusters with different values of the 𝒞 parameter. Top: cluster PSZ2 G075.71+13.51 (PSZ2 index 322). Middle: cluster PSZ2 G340.88−33.36 (PSZ2 index 1591). Bottom: cluster PSZ2 G093.94−38.82 (PSZ2 index 430). Each map is centred on the cluster position reported in the PSZ2 catalogue, with side-length equal to 2θ500. The white circle is the aperture defined for the Zernike fit. The markers in green in the top-right corner of each map are used to indicate the respective values of the 𝒞 parameter in Fig. 3. Right: Bar charts of the cn,±m coefficients (see Eq. (11)) resulting from the Zernike fit applied on each map on the left. The ZPs on the x axis are ordered following the Noll's scheme (Noll 1976). The polynomial order n increases from left to right. Orange and blue bars refer to ZPs with m = 0 and m≠0, respectively.
Current usage metrics show cumulative count of Article Views (full-text article views including HTML views, PDF and ePub downloads, according to the available data) and Abstracts Views on Vision4Press platform.
Data correspond to usage on the plateform after 2015. The current usage metrics is available 48-96 hours after online publication and is updated daily on week days.
Initial download of the metrics may take a while.