Fig. 6
Download original image
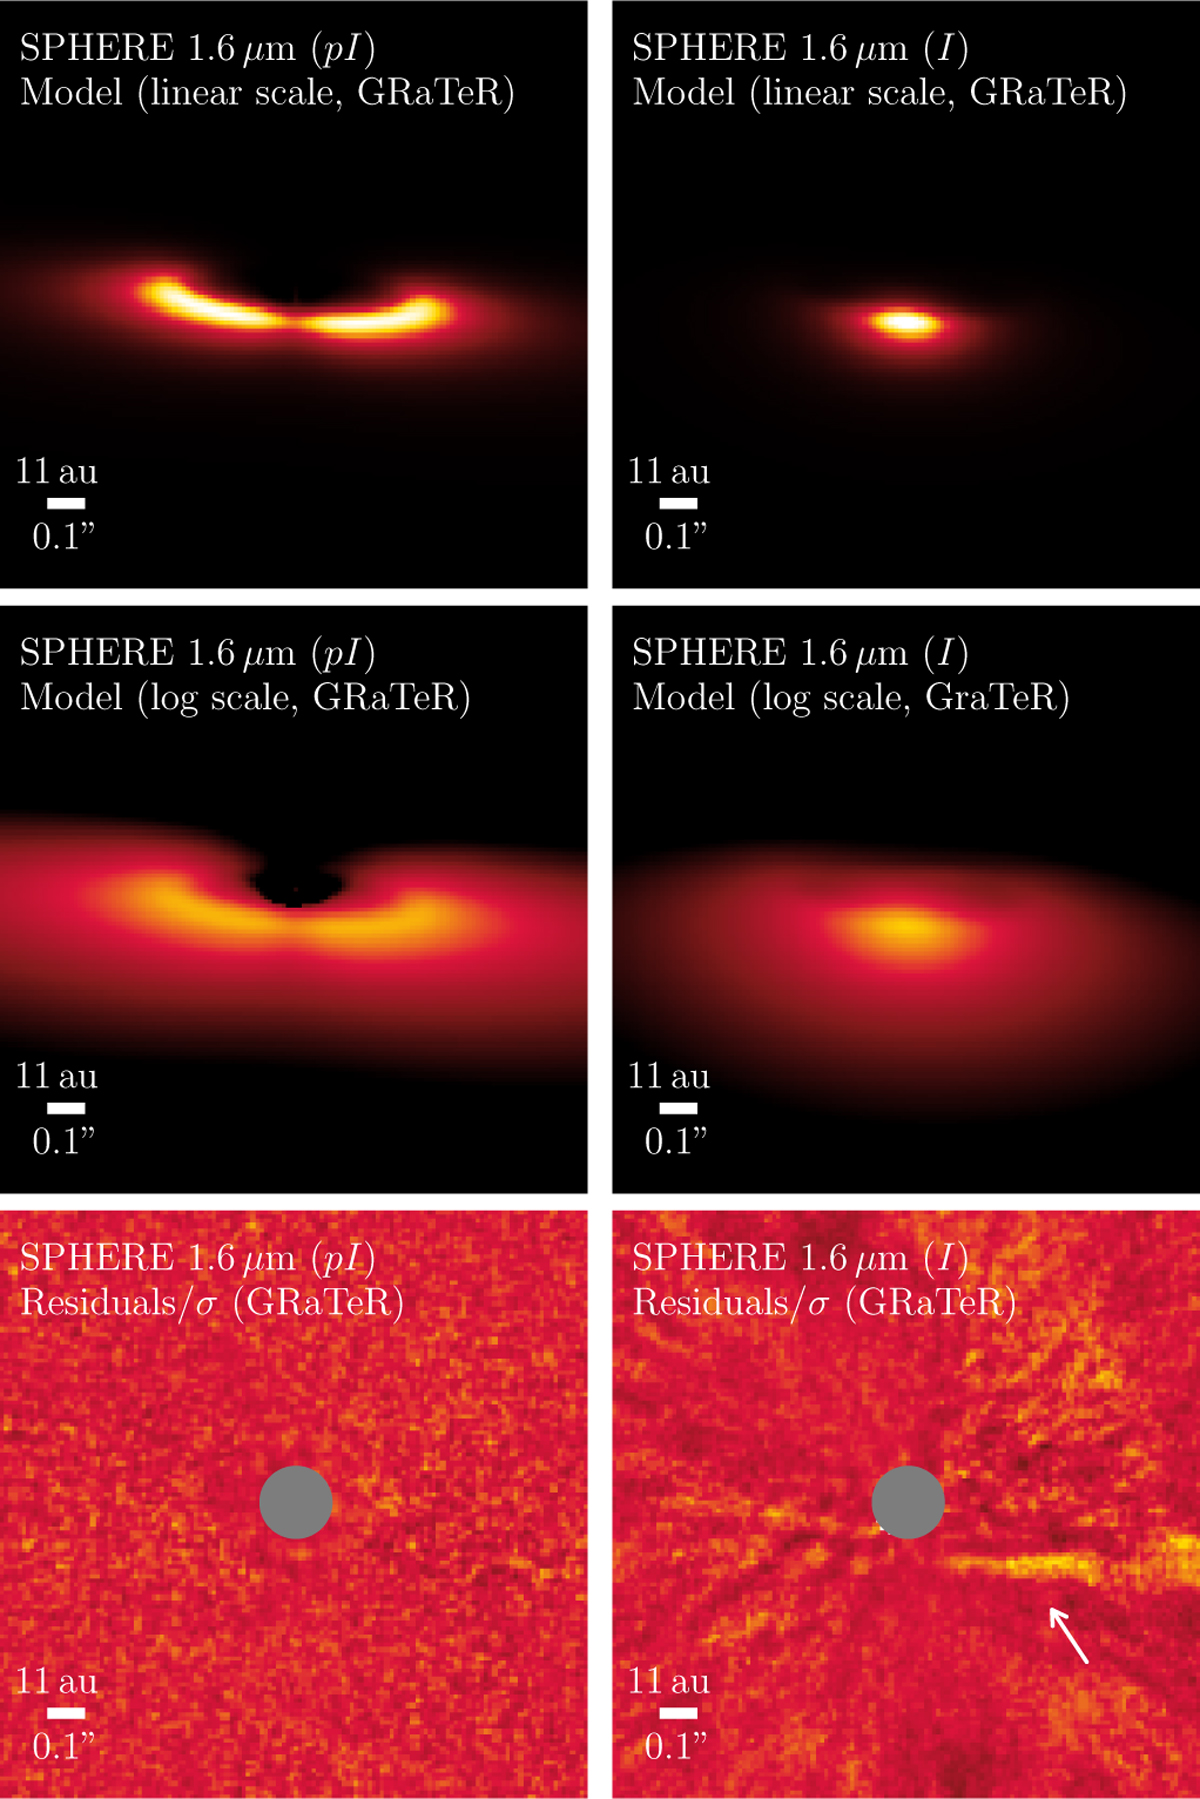
Results of our MCMC simulations, using the Pythonized version of the GRaTeR tool to generate the belt model. We show the best models in linear or logarithmic scales (top and middle), and the associated residuals normalized by the noise (“σ”, bottom). Scattered light images for the polarized intensity images are on the left and those for total intensity images on the right. Some signal is still visible in the total intensity residuals, and is indicated by the white arrow. Unlike the disk model in total intensity, the disk model in polarized intensity accounts for Rayleigh scattering, hence visual brightness differences between these disk models depending on the scattering angle. The best-fitting parameters are given in Table 1. As a reminder, since the disk inclination found is 78°, the scattering angle is 12° at the closest location of the belt, 90° in the anses, and 168° at its furthest location (see also Fig. 5 from Perrin et al. 2015, to have an insight of the scattering angles around a dust belt).
Current usage metrics show cumulative count of Article Views (full-text article views including HTML views, PDF and ePub downloads, according to the available data) and Abstracts Views on Vision4Press platform.
Data correspond to usage on the plateform after 2015. The current usage metrics is available 48-96 hours after online publication and is updated daily on week days.
Initial download of the metrics may take a while.