Fig. E.2
Download original image
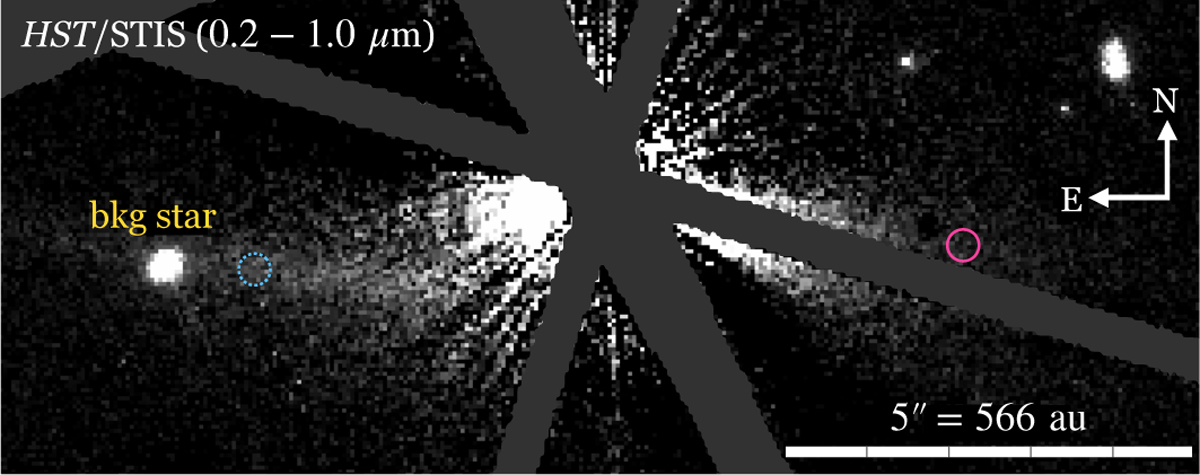
Location of the two regions of interest of dust grains in the extended dust emission seen in the HST/STIS reduced image. The dotted blue circle corresponds to the region located at a projected distance close to the background star, while the solid pink circle corresponds to the region located a projected distance far to the background star. Unlike Fig. 4, no spatial binning is applied on this image.
Current usage metrics show cumulative count of Article Views (full-text article views including HTML views, PDF and ePub downloads, according to the available data) and Abstracts Views on Vision4Press platform.
Data correspond to usage on the plateform after 2015. The current usage metrics is available 48-96 hours after online publication and is updated daily on week days.
Initial download of the metrics may take a while.