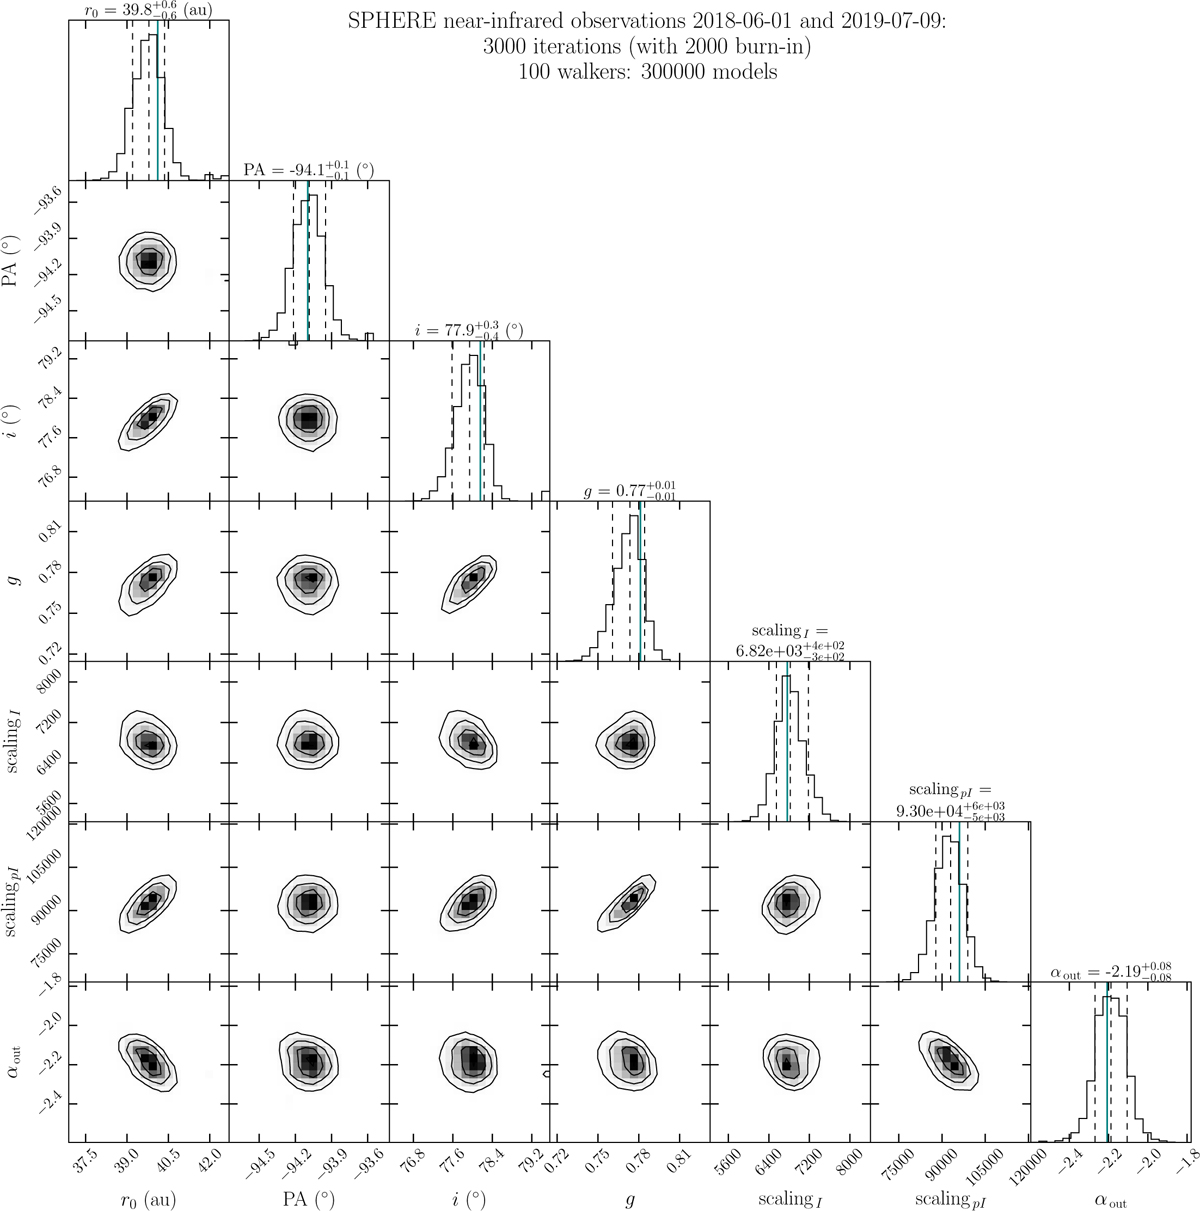
Fig. D.1
Download original image
Posteriors of the MCMC exploration of the parameter space for the disk seen in NIR (1.6 μm) SPHERE observations in polarized and total intensity. The vertical dashed lines represents the values of the median and at ±1σ, which are defined as the 15.9% and 84.1% percentiles to encompass 68.2% of the solutions for a given parameter. The blue vertical line represent the best-fitting parameters, which are the values minimizing the ![]() .
.
Current usage metrics show cumulative count of Article Views (full-text article views including HTML views, PDF and ePub downloads, according to the available data) and Abstracts Views on Vision4Press platform.
Data correspond to usage on the plateform after 2015. The current usage metrics is available 48-96 hours after online publication and is updated daily on week days.
Initial download of the metrics may take a while.