Fig. 10
Download original image
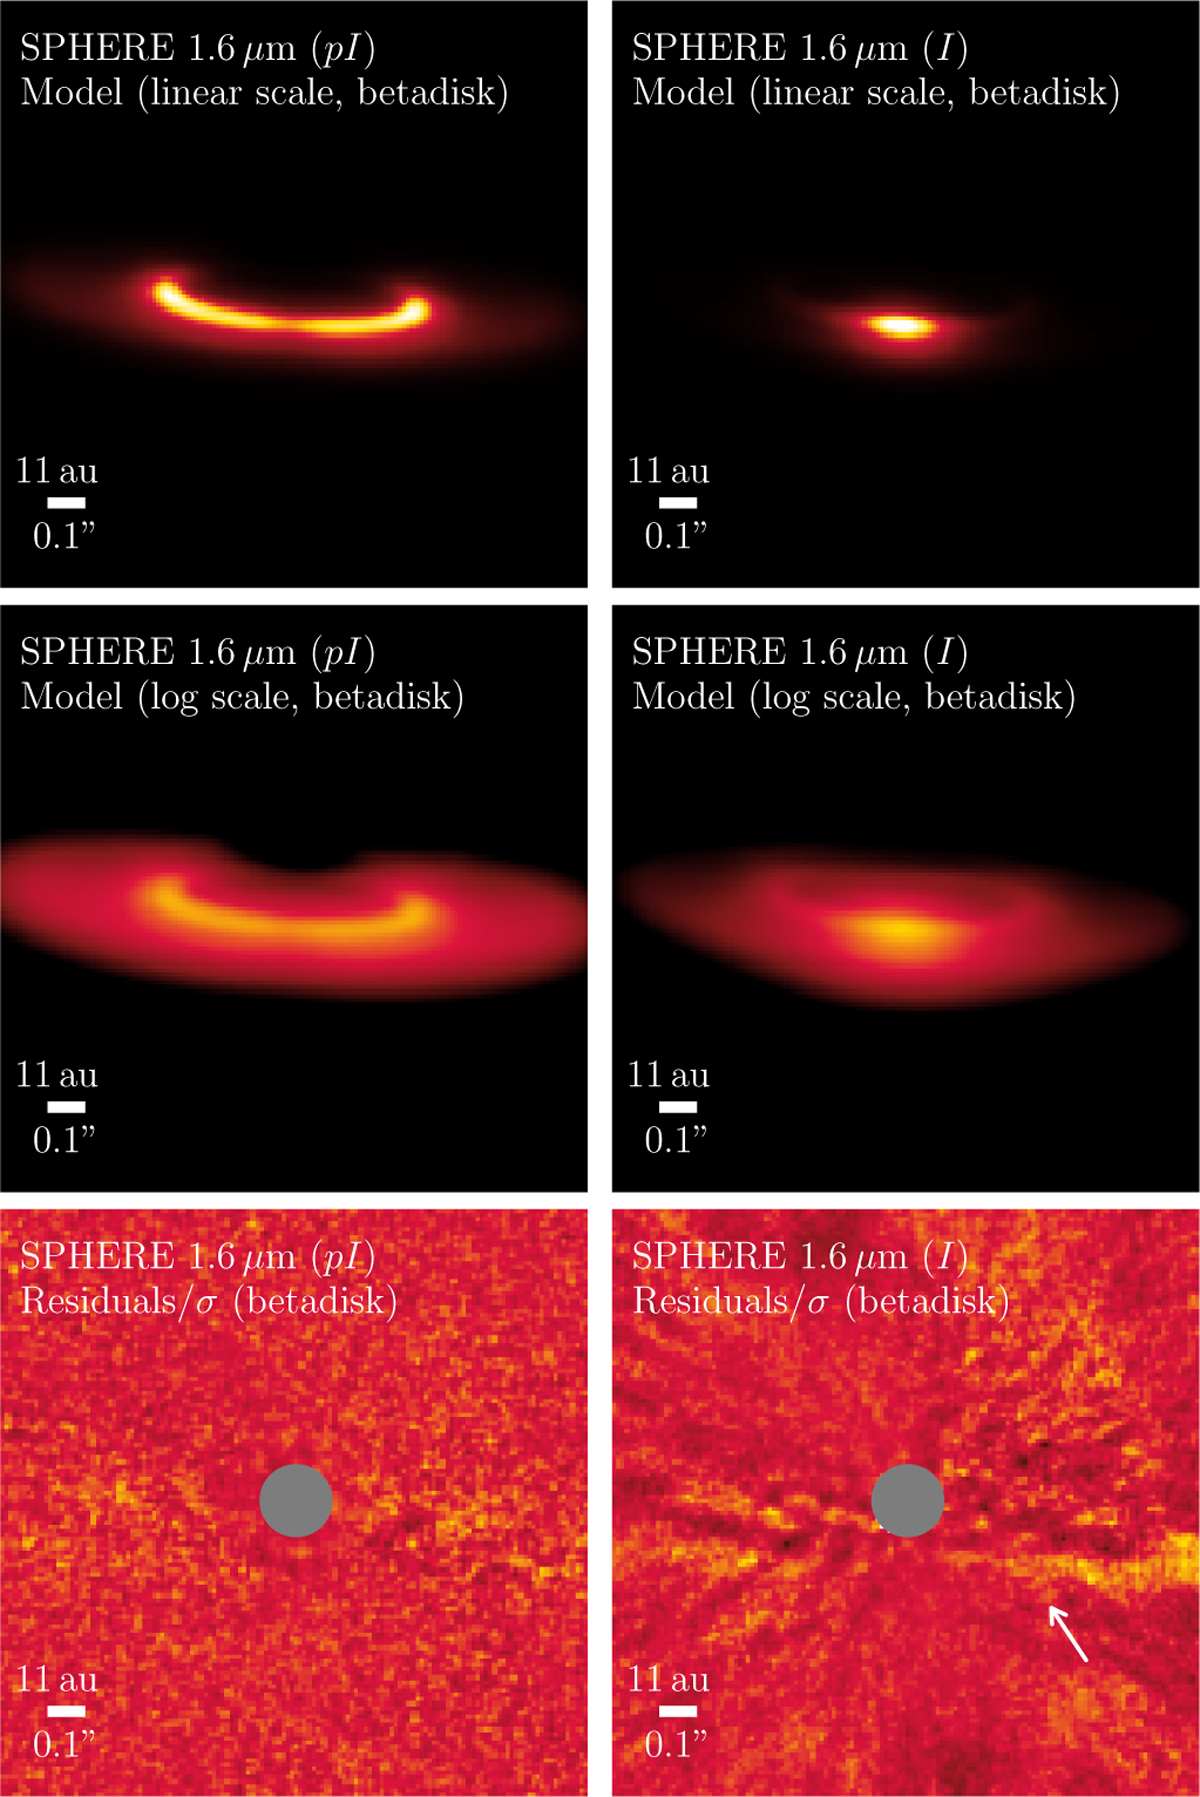
Scattered light images of one dust belt generated using the code betadisk, with the associated residual map normalized by the noise ("σ"), in polarized and total intensity (left and right, respectively). The second structure seen with SPHERE (indicated by the white arrow) is somehow more removed, compared to the GRaTeR modeling (Fig. 6, bottom-right).
Current usage metrics show cumulative count of Article Views (full-text article views including HTML views, PDF and ePub downloads, according to the available data) and Abstracts Views on Vision4Press platform.
Data correspond to usage on the plateform after 2015. The current usage metrics is available 48-96 hours after online publication and is updated daily on week days.
Initial download of the metrics may take a while.