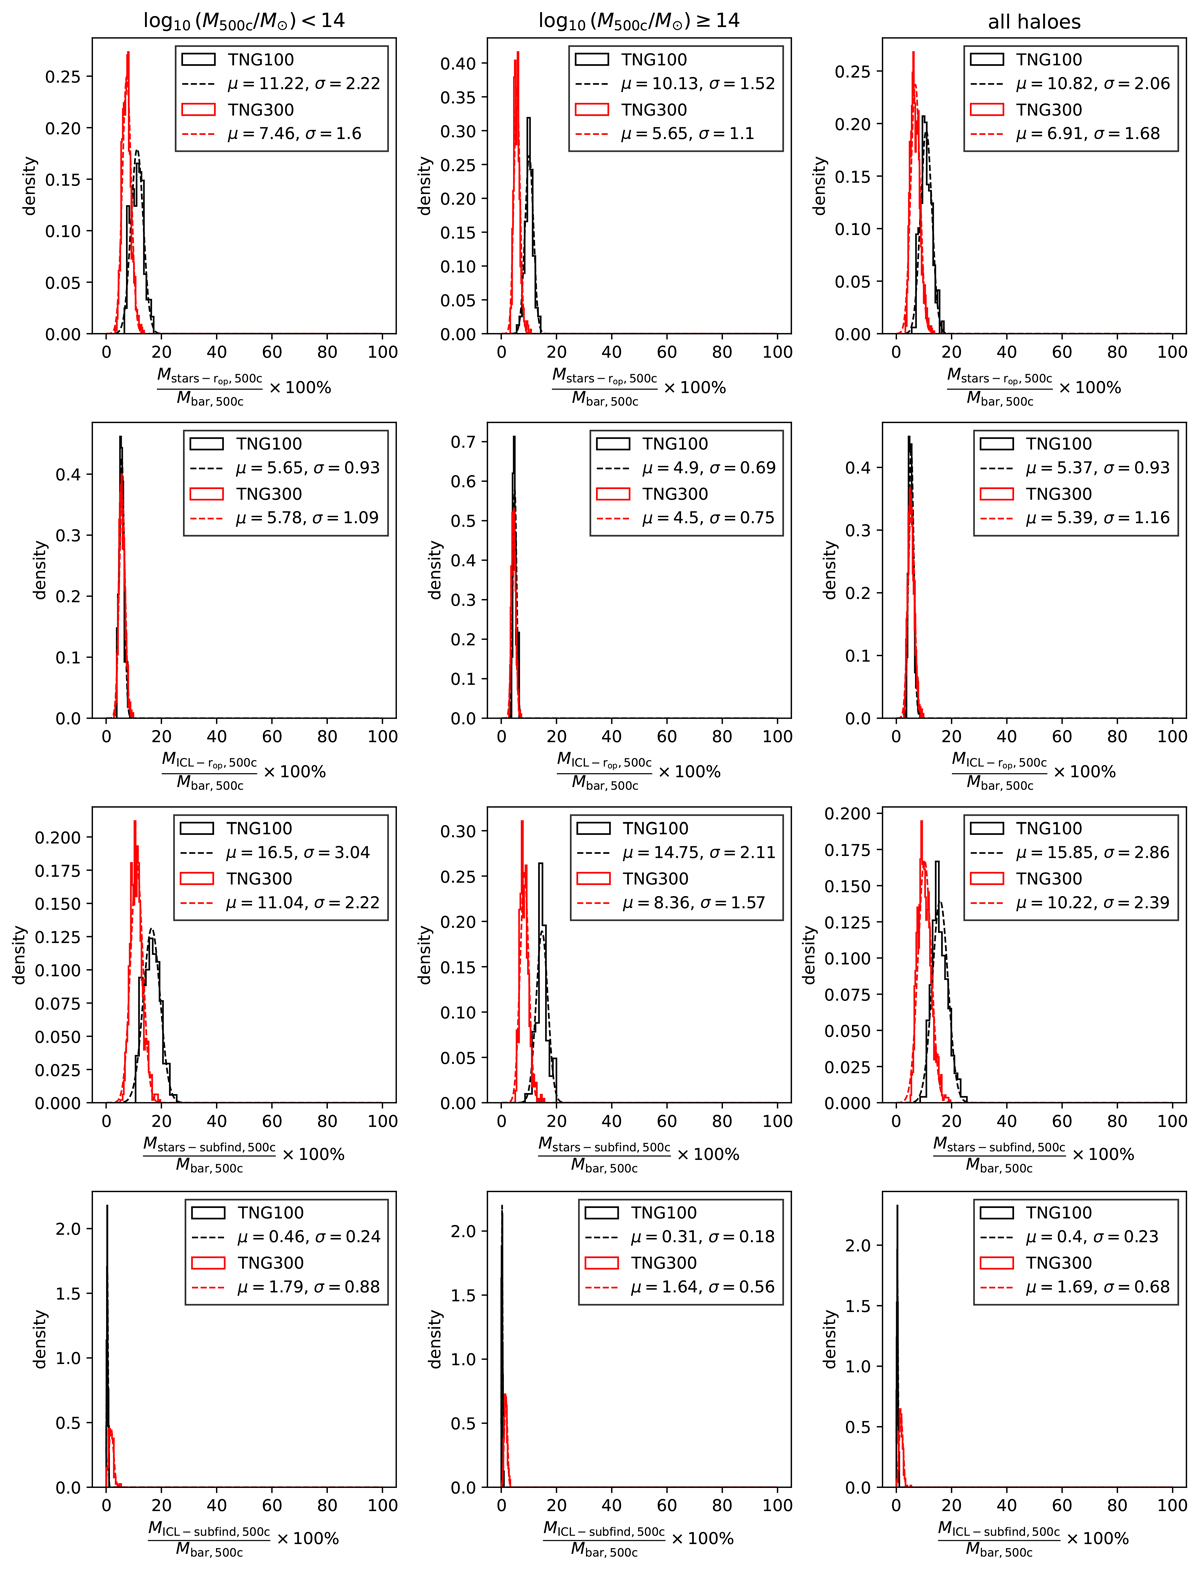
Fig. A.2.
Download original image
Porcentual distributions stellar masses considering the baryonic masses. Stellar galaxy mass in rop aperture (upper row panels), ICL mass in rop aperture (upper centre row panels), stellar galaxy mass in Subfind aperture (bottom centre row panels) and ICL mass in Subfind aperture (bottom row panels). The histograms are divided in the haloes with ![]() (left colum panels),
(left colum panels), ![]() (centre colum panels) and all halo (right colum panels) masses. (Black histograms) TNG100 haloes. (Red histograms) TNG300 haloes. The dashed lines represent the normal distribution fitted in their respective histogram (with their respective colour).
(centre colum panels) and all halo (right colum panels) masses. (Black histograms) TNG100 haloes. (Red histograms) TNG300 haloes. The dashed lines represent the normal distribution fitted in their respective histogram (with their respective colour).
Current usage metrics show cumulative count of Article Views (full-text article views including HTML views, PDF and ePub downloads, according to the available data) and Abstracts Views on Vision4Press platform.
Data correspond to usage on the plateform after 2015. The current usage metrics is available 48-96 hours after online publication and is updated daily on week days.
Initial download of the metrics may take a while.