Fig. 5.
Download original image
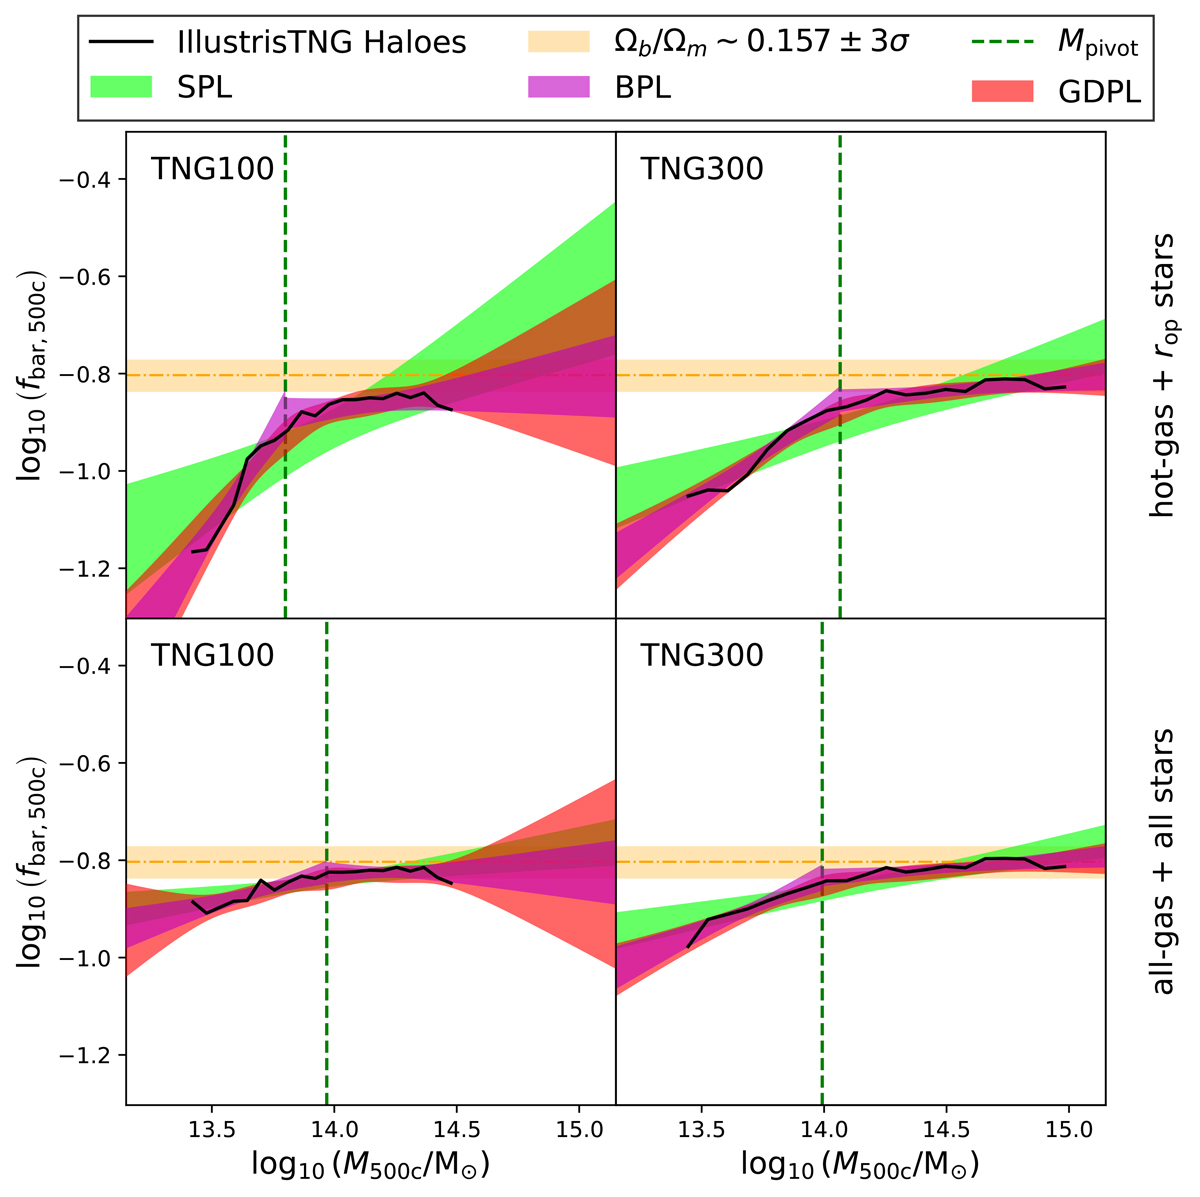
SPL fit (green region), BPL fit (magenta region) and GDPL fit (red region) of the IllustrisTNG haloes (median of the data in black solid line), to the scaling relation of the mass fraction of baryons fbar and halo mass M in a radius R500c. Each panel is labelled with the corresponding simulation tag in addition to a vertical dark green dashed line that represents the Mpivot of the broken fits. The power values of αSPL SPL fits, αBPL,1 and αBPL,2 BLP fits, and αGDPL,1 and αGDPL,2 GDPL fits, with the GDPL smoothness parameter δ and Mpivot value are in the Table 5. Top panels: fraction of baryons includes the hot-gas and the ![]() aperture. Bottom panels: baryon fraction includes all gas and stellar mass within each halo. The yellow region represent the Planck Collaboration XIII (2016) fraction of baryons. All the regions are in 3σ.
aperture. Bottom panels: baryon fraction includes all gas and stellar mass within each halo. The yellow region represent the Planck Collaboration XIII (2016) fraction of baryons. All the regions are in 3σ.
Current usage metrics show cumulative count of Article Views (full-text article views including HTML views, PDF and ePub downloads, according to the available data) and Abstracts Views on Vision4Press platform.
Data correspond to usage on the plateform after 2015. The current usage metrics is available 48-96 hours after online publication and is updated daily on week days.
Initial download of the metrics may take a while.