Fig. 4.
Download original image
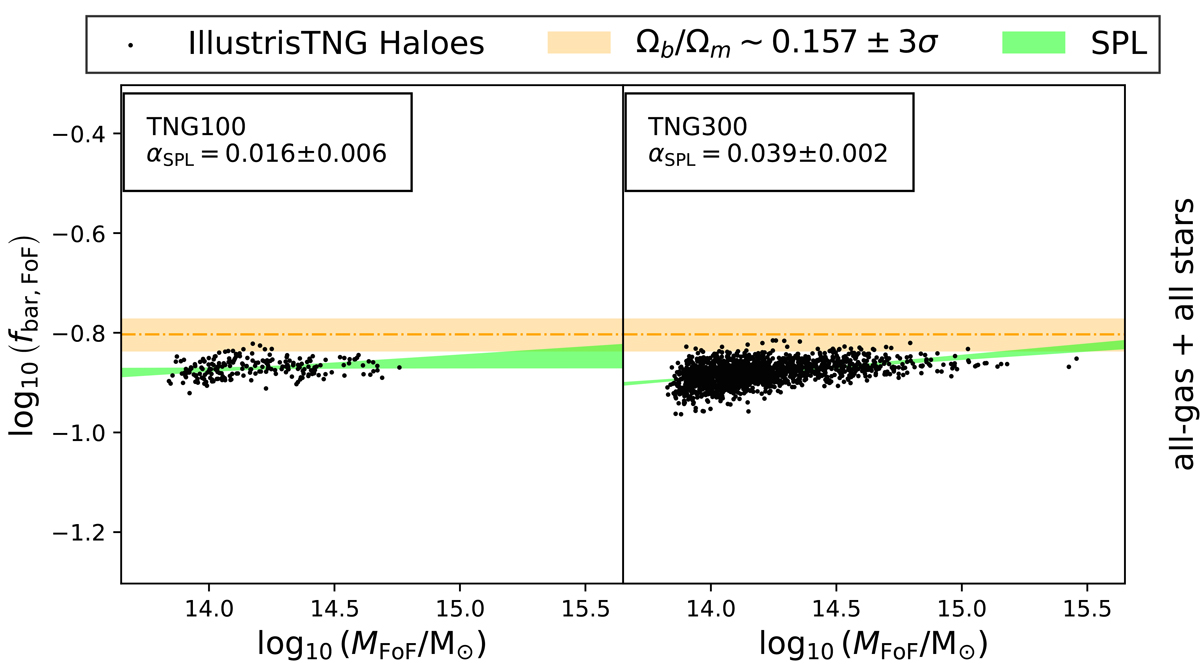
SPL fit (green region) of the IllustrisTNG haloes (black dots), to the scaling relation of the mass fraction of baryons fbar and halo mass M measured by the FoF algorithm, for all redshifts. Each panel is labelled with the corresponding simulation tag and the value of the αSPL slope in the upper-left corner. The baryon fraction includes all gas and stellar mass within each halo. The yellow region represents the baryon fraction from Planck Collaboration XIII (2016). All regions are in 3σ.
Current usage metrics show cumulative count of Article Views (full-text article views including HTML views, PDF and ePub downloads, according to the available data) and Abstracts Views on Vision4Press platform.
Data correspond to usage on the plateform after 2015. The current usage metrics is available 48-96 hours after online publication and is updated daily on week days.
Initial download of the metrics may take a while.