Fig. 1.
Download original image
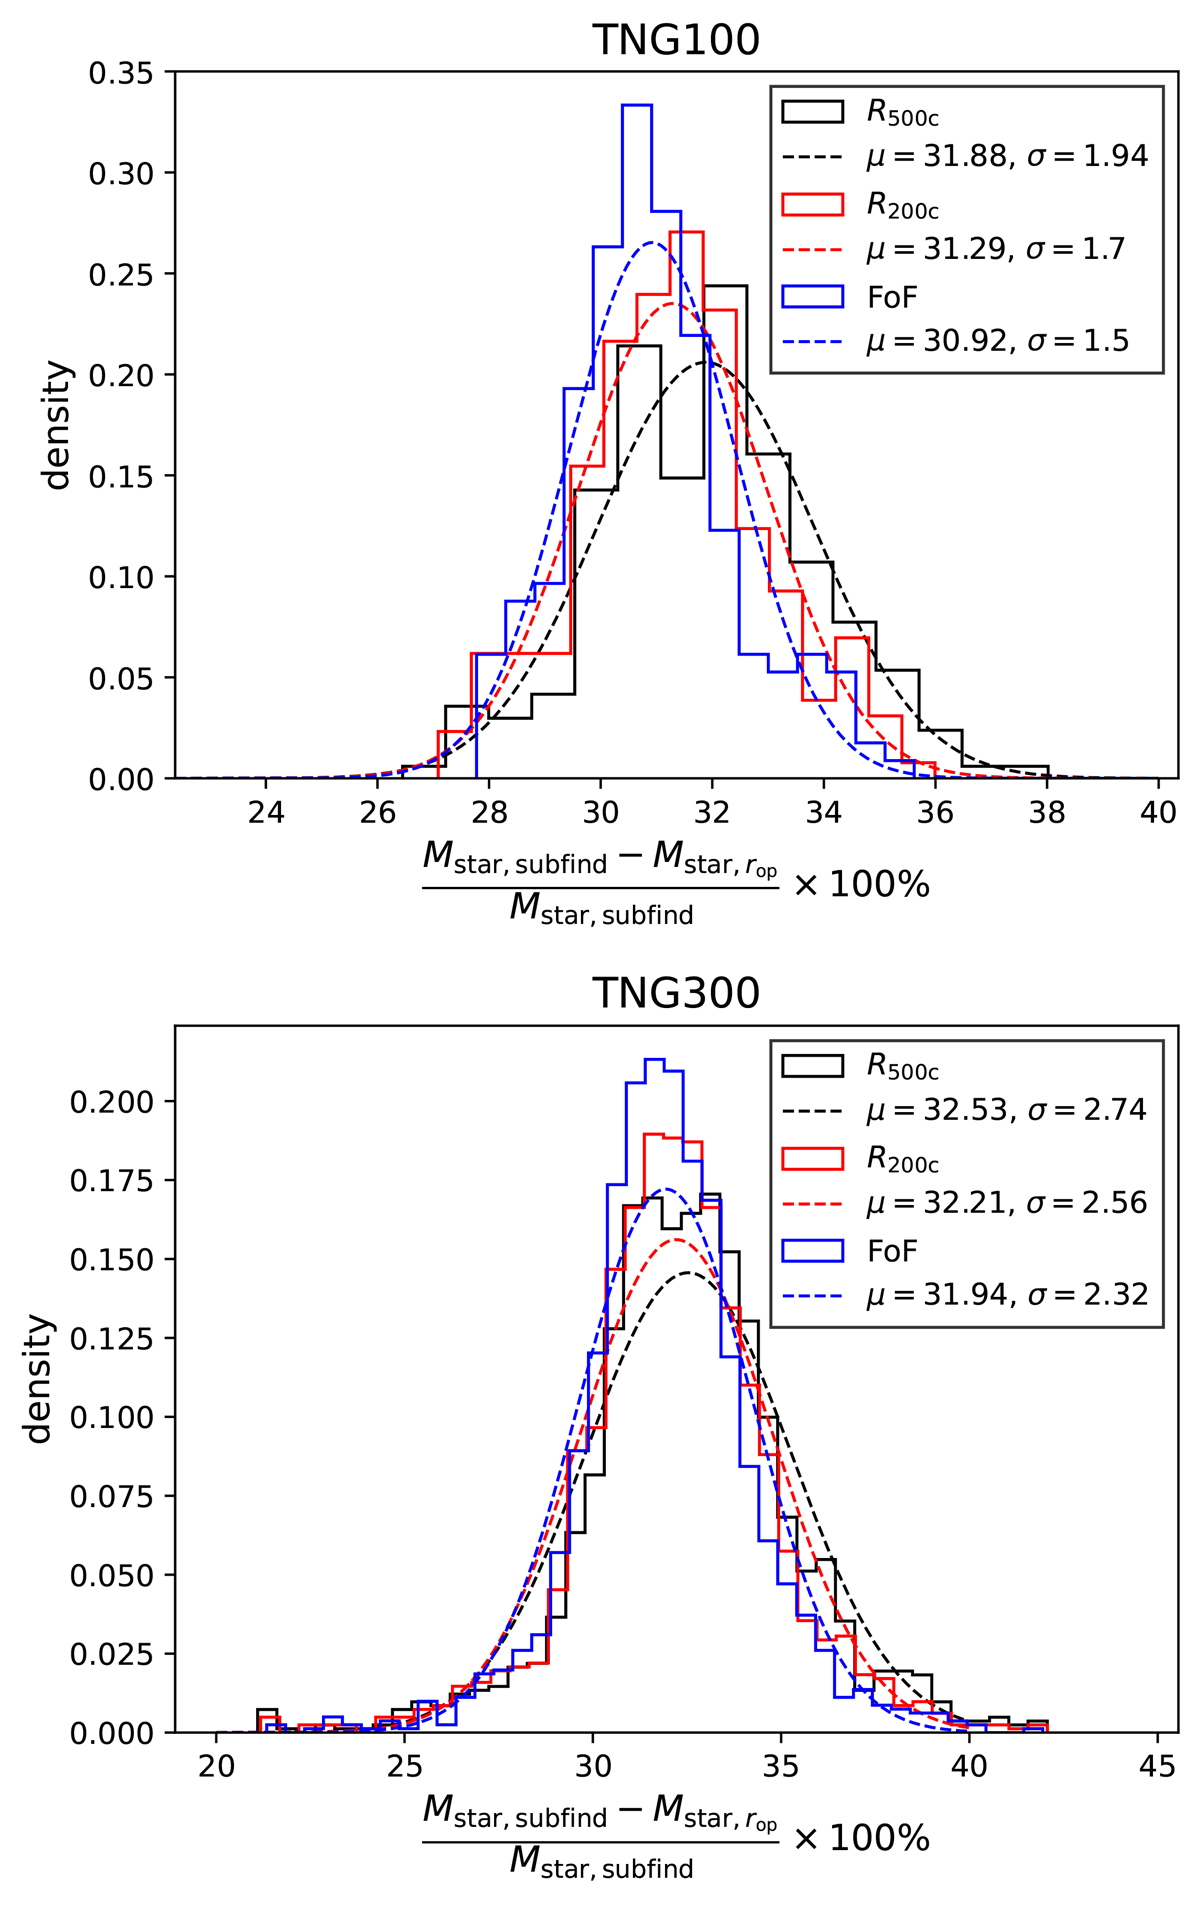
Distribution of the percentage difference between the stellar masses from Subfind and ![]() apertures under different constrains. The black, red, and blue lines correspond to measurements within halocentric radius R500c, R200c, and the mass considered by the FoF algorithm, respectively. The dashed lines represent the normal distribution fitted to each constraint and are shown in their corresponding colour.
apertures under different constrains. The black, red, and blue lines correspond to measurements within halocentric radius R500c, R200c, and the mass considered by the FoF algorithm, respectively. The dashed lines represent the normal distribution fitted to each constraint and are shown in their corresponding colour.
Current usage metrics show cumulative count of Article Views (full-text article views including HTML views, PDF and ePub downloads, according to the available data) and Abstracts Views on Vision4Press platform.
Data correspond to usage on the plateform after 2015. The current usage metrics is available 48-96 hours after online publication and is updated daily on week days.
Initial download of the metrics may take a while.