Fig. 6
Download original image
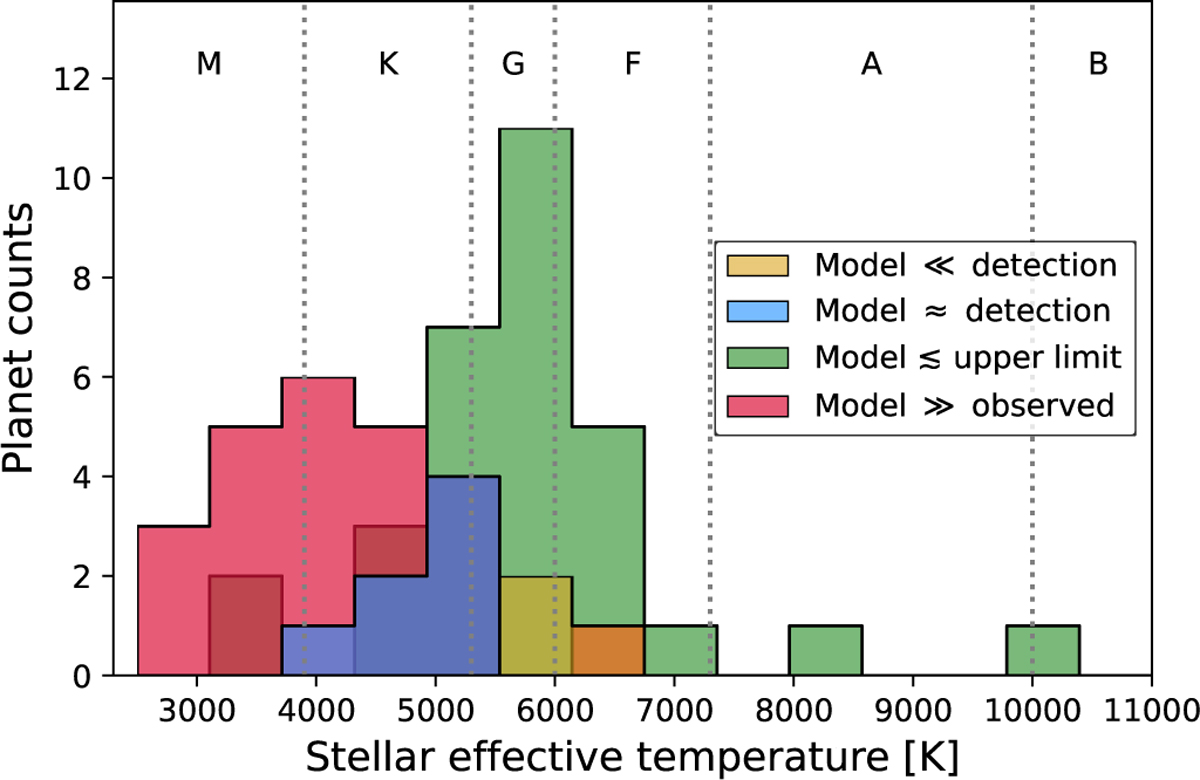
Host star effective temperatures of the planets with metastable helium observations in Fig. 5 separated by the accuracy of the model predictions. In this figure, we adopt a relatively strict factor of two when classifying a model as accurate. So, the red histogram includes the planets for which the model helium EW is more than a factor two higher than the observed EW (i.e., both detections and upper limits toward the bottom-right part of Fig. 5). The blue histogram includes the planets with helium detections that are accurately predicted by our model within a factor two. The green histogram includes the planets where a reported upper limit is above half the model value (i.e., upper limits toward the top-left part of Fig. 5; we consider these consistent as well). The yellow histogram includes the planets with detections that are above two times the model EW (i.e., HAT-P-67 b, HAT-P-32 b, and HD 209458 b). We see that our model tends to overestimate the helium signal particularly for planets around M- and K-type stars.
Current usage metrics show cumulative count of Article Views (full-text article views including HTML views, PDF and ePub downloads, according to the available data) and Abstracts Views on Vision4Press platform.
Data correspond to usage on the plateform after 2015. The current usage metrics is available 48-96 hours after online publication and is updated daily on week days.
Initial download of the metrics may take a while.