Fig. 2
Download original image
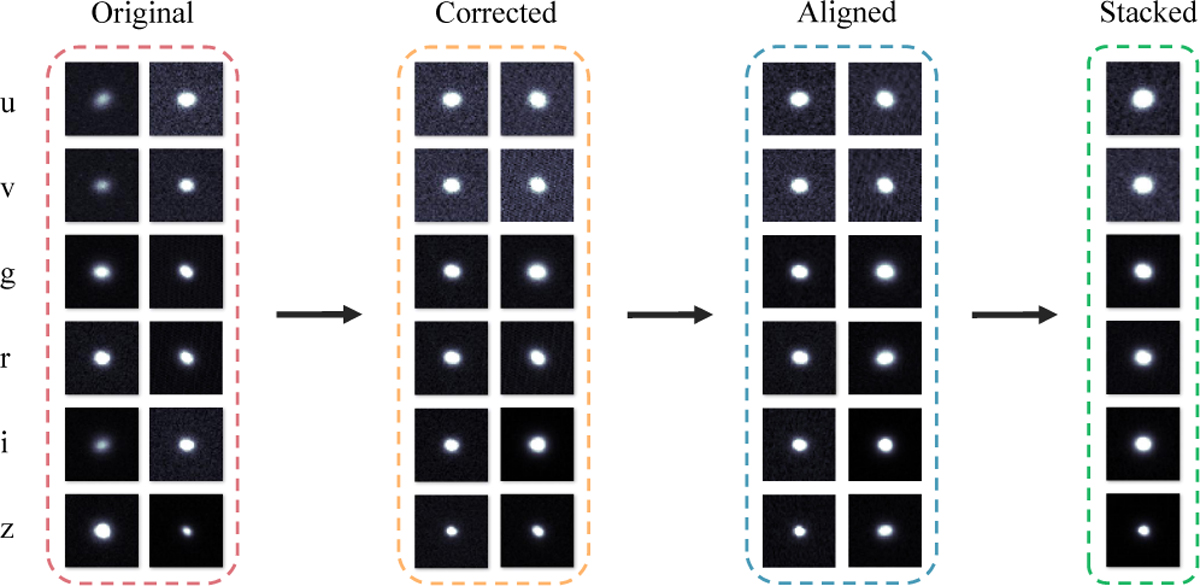
Visualization of the data processing procedure. The “Original” panel displays the raw photometric images of a target object across six bands (u, v, g, r, i, and z) from the SMSS DR4, where each band can include multiple detections. For clarity, only two representative detections are shown. The “Corrected” panel shows the photometric images after applying zeropoint and reddening corrections. Subsequently, image reprojection is performed to achieve precise spatial alignment, as demonstrated in the “Aligned” panel. Finally, the “Stacked” panel presents the stacked photometric images generated through a simple averaging method.
Current usage metrics show cumulative count of Article Views (full-text article views including HTML views, PDF and ePub downloads, according to the available data) and Abstracts Views on Vision4Press platform.
Data correspond to usage on the plateform after 2015. The current usage metrics is available 48-96 hours after online publication and is updated daily on week days.
Initial download of the metrics may take a while.