Fig. 13
Download original image
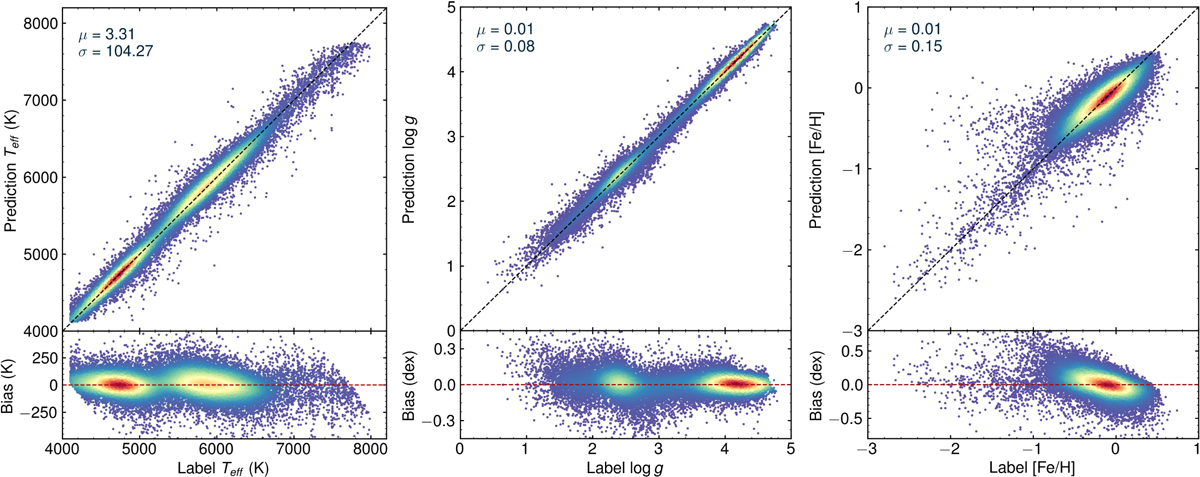
Regression results for three stellar atmospheric parameters in the low-quality validation set: Teff (left panel), log g (middle panel), and [Fe/H] (right panel). The top part of each panel shows spectroscopic labels versus photometric predictions derived using the algorithm described in Sect. 3. The bottom part display the residuals between photometric predictions and spectroscopic labels, with the overall offset (μ) and standard deviation (σ) marked in the top-left corner of top part. To enhance clarity and visualize trends, we use the kernel density estimation method to model the probability densities of the results, represented as a color gradient ranging from purple (low density) to red (high density). Black dashed lines denote the one-to-one relationship, while red dashed lines mark zero residuals in each panel.
Current usage metrics show cumulative count of Article Views (full-text article views including HTML views, PDF and ePub downloads, according to the available data) and Abstracts Views on Vision4Press platform.
Data correspond to usage on the plateform after 2015. The current usage metrics is available 48-96 hours after online publication and is updated daily on week days.
Initial download of the metrics may take a while.