Open Access
Fig. 8.
Download original image
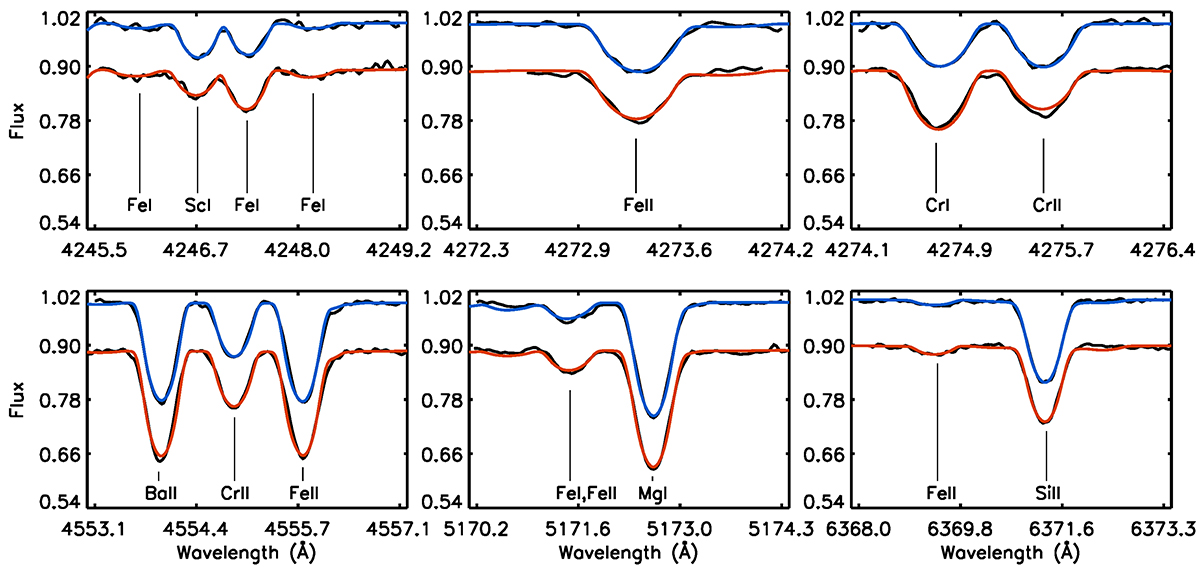
Comparison of the observed (black lines) and theoretical spectra calculated with final parameters. Star 1 is represented by the blue line, and Star 2 by the red line. The spectra of Star 2 were shifted by subtracting a value of 0.1 from the flux.
Current usage metrics show cumulative count of Article Views (full-text article views including HTML views, PDF and ePub downloads, according to the available data) and Abstracts Views on Vision4Press platform.
Data correspond to usage on the plateform after 2015. The current usage metrics is available 48-96 hours after online publication and is updated daily on week days.
Initial download of the metrics may take a while.