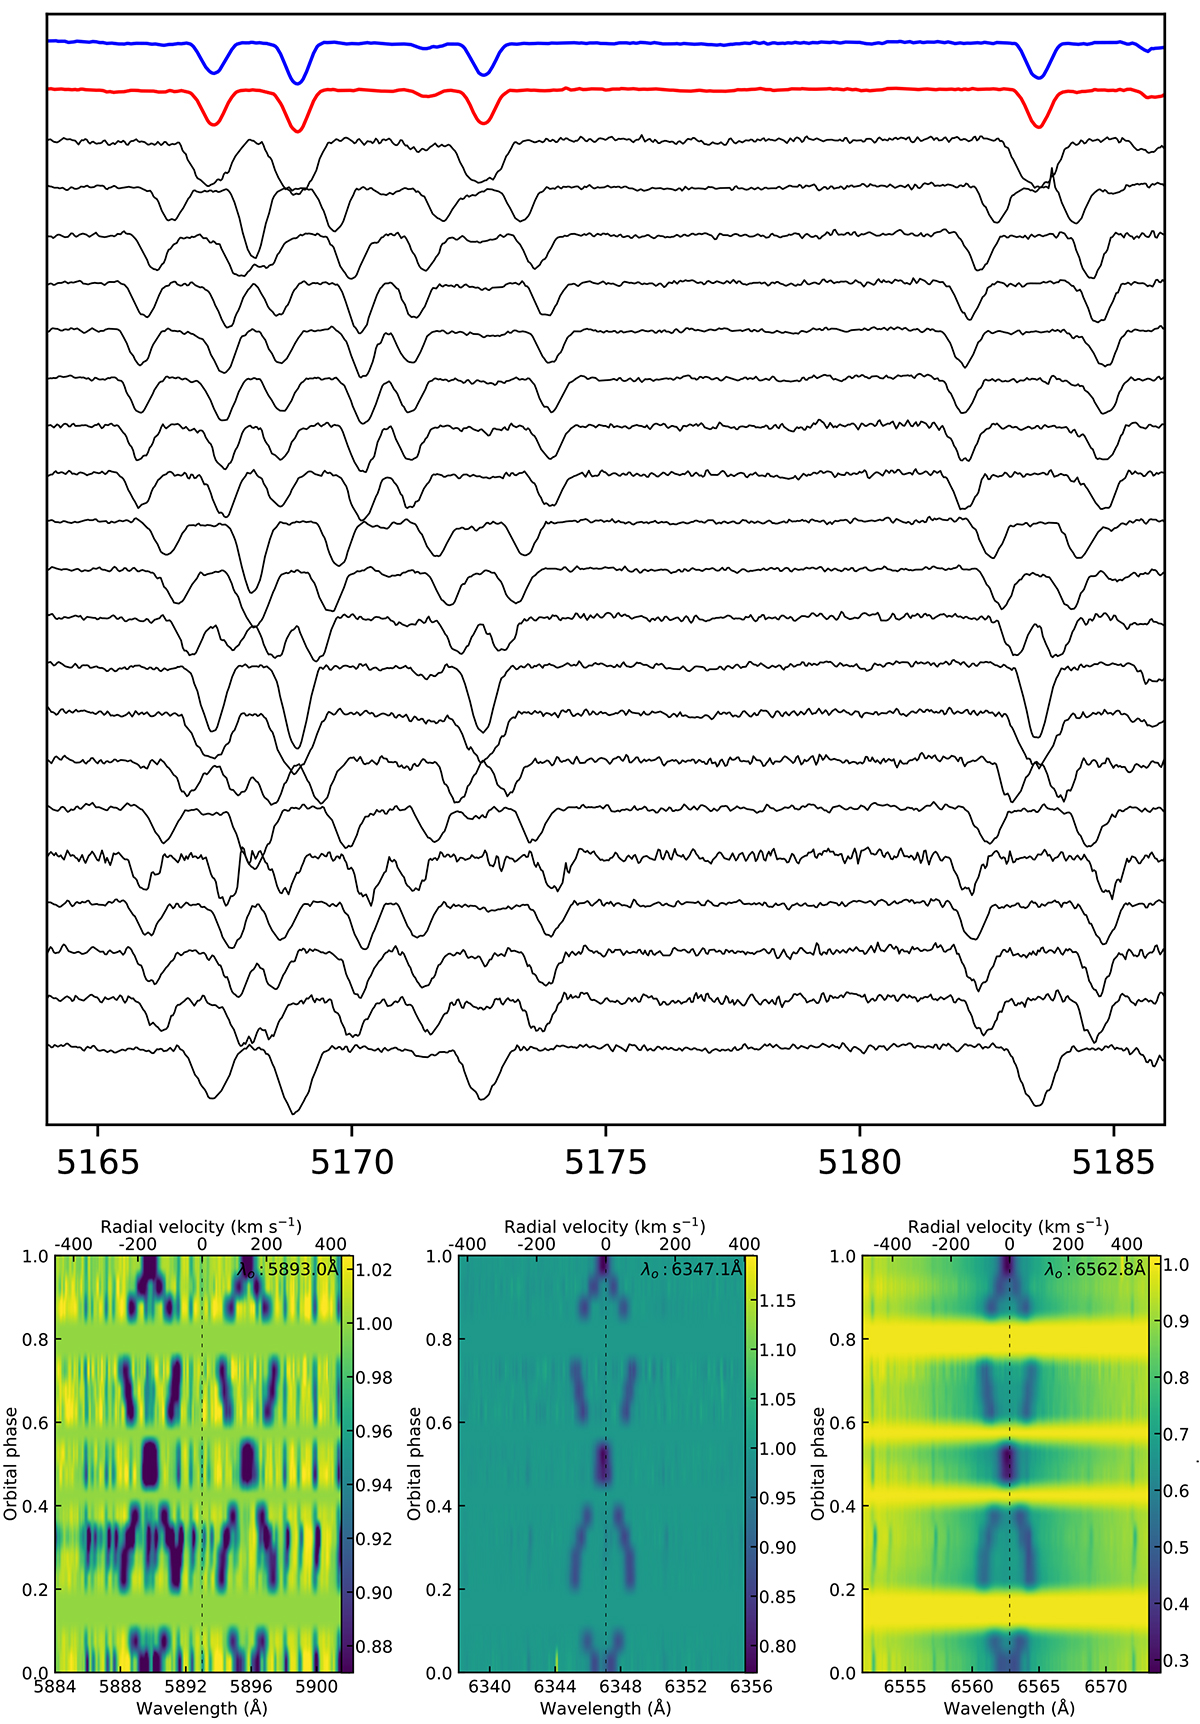
Fig. 6.
Download original image
Top: Observed spectra in different orbital phases around the Mg I 5167–5183 Å triplet and Fe II 5169 Å lines. The mean disentangled spectra for the primary and secondary components are shown in blue and red, respectively. Bottom: Trails of Na D, Si II, and Hα lines (from left to right) showing the variation of the position of the lines of both components during the orbital cycle. The relative intensity of the lines is also indicated.
Current usage metrics show cumulative count of Article Views (full-text article views including HTML views, PDF and ePub downloads, according to the available data) and Abstracts Views on Vision4Press platform.
Data correspond to usage on the plateform after 2015. The current usage metrics is available 48-96 hours after online publication and is updated daily on week days.
Initial download of the metrics may take a while.