Fig. 4.
Download original image
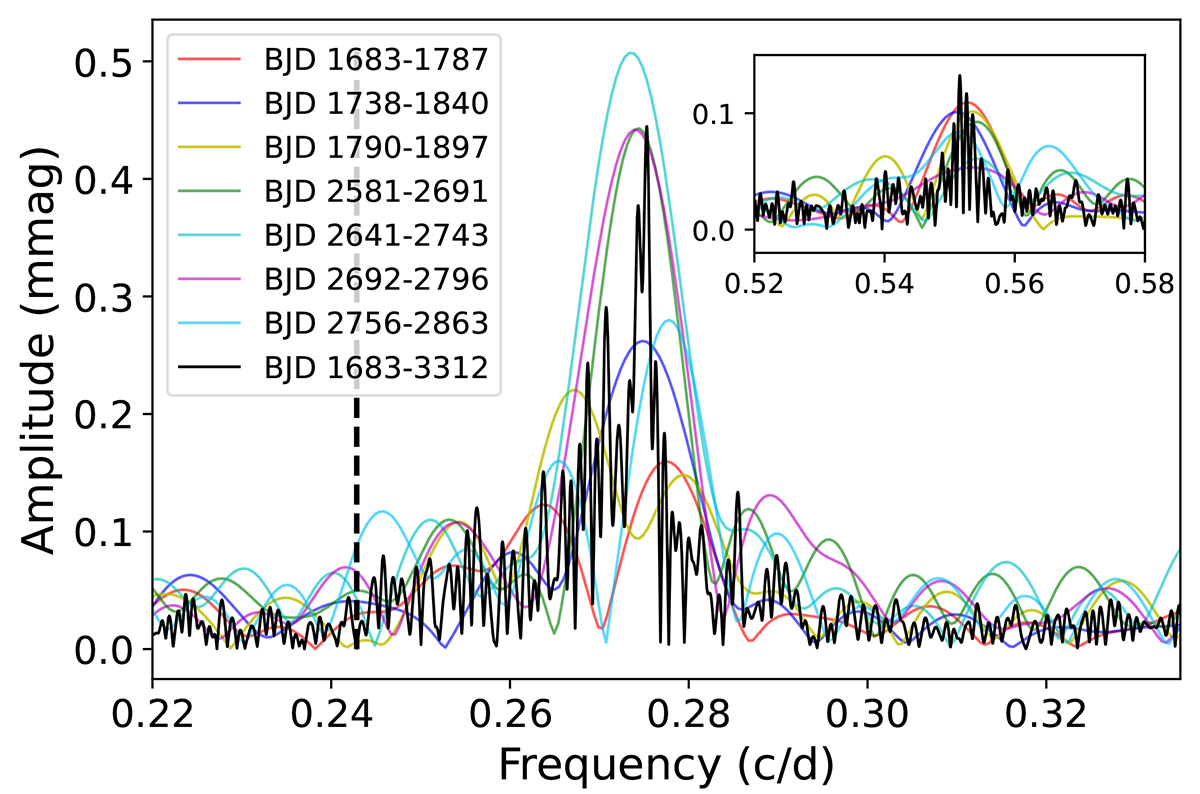
Frequency spectrum centred around a group of peaks produced by additional variability from different data segments (coloured lines) and the full data set (black line). The amplitude of the frequency spectrum of the full dataset is multiplied by two for better readability. The black dashed line denotes the position of the orbital and rotational frequency.
Current usage metrics show cumulative count of Article Views (full-text article views including HTML views, PDF and ePub downloads, according to the available data) and Abstracts Views on Vision4Press platform.
Data correspond to usage on the plateform after 2015. The current usage metrics is available 48-96 hours after online publication and is updated daily on week days.
Initial download of the metrics may take a while.