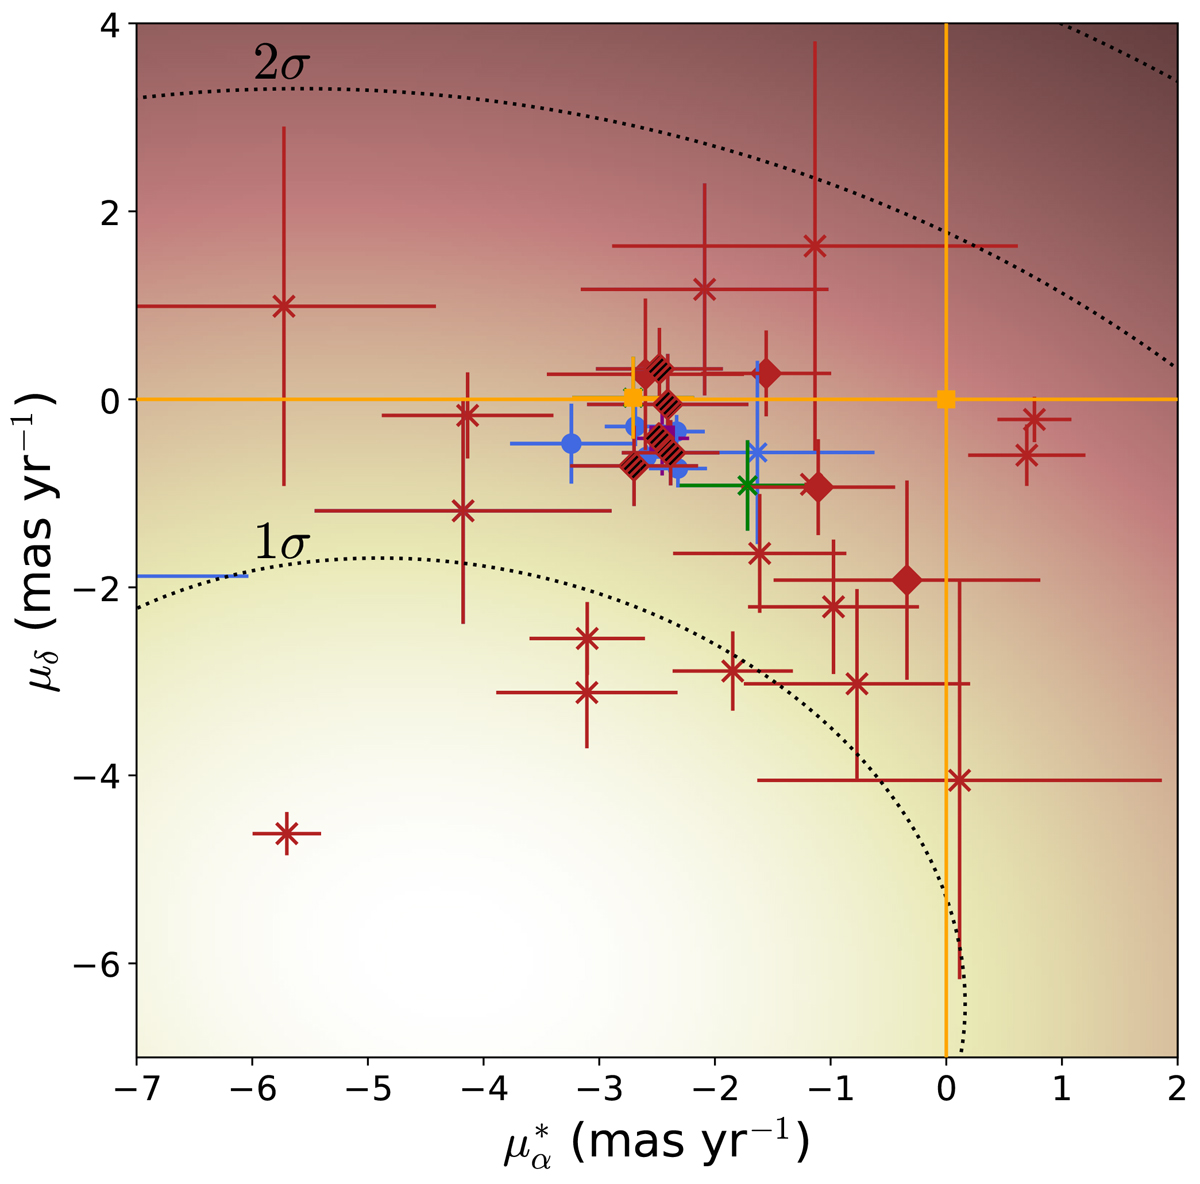
Fig. 7.
Download original image
Proper motions of the full spectroscopic sample. The plot is restricted to an area around the proper motion of Boo II for the sake of visibility, but other stars (clearly non-members) are located outside this region. The density background shows the density of MW star in the field of Boo II, with 1 and 2σ contours shown as dashed black lines. The colour and marker schemes are the same as in previous plots.
Current usage metrics show cumulative count of Article Views (full-text article views including HTML views, PDF and ePub downloads, according to the available data) and Abstracts Views on Vision4Press platform.
Data correspond to usage on the plateform after 2015. The current usage metrics is available 48-96 hours after online publication and is updated daily on week days.
Initial download of the metrics may take a while.