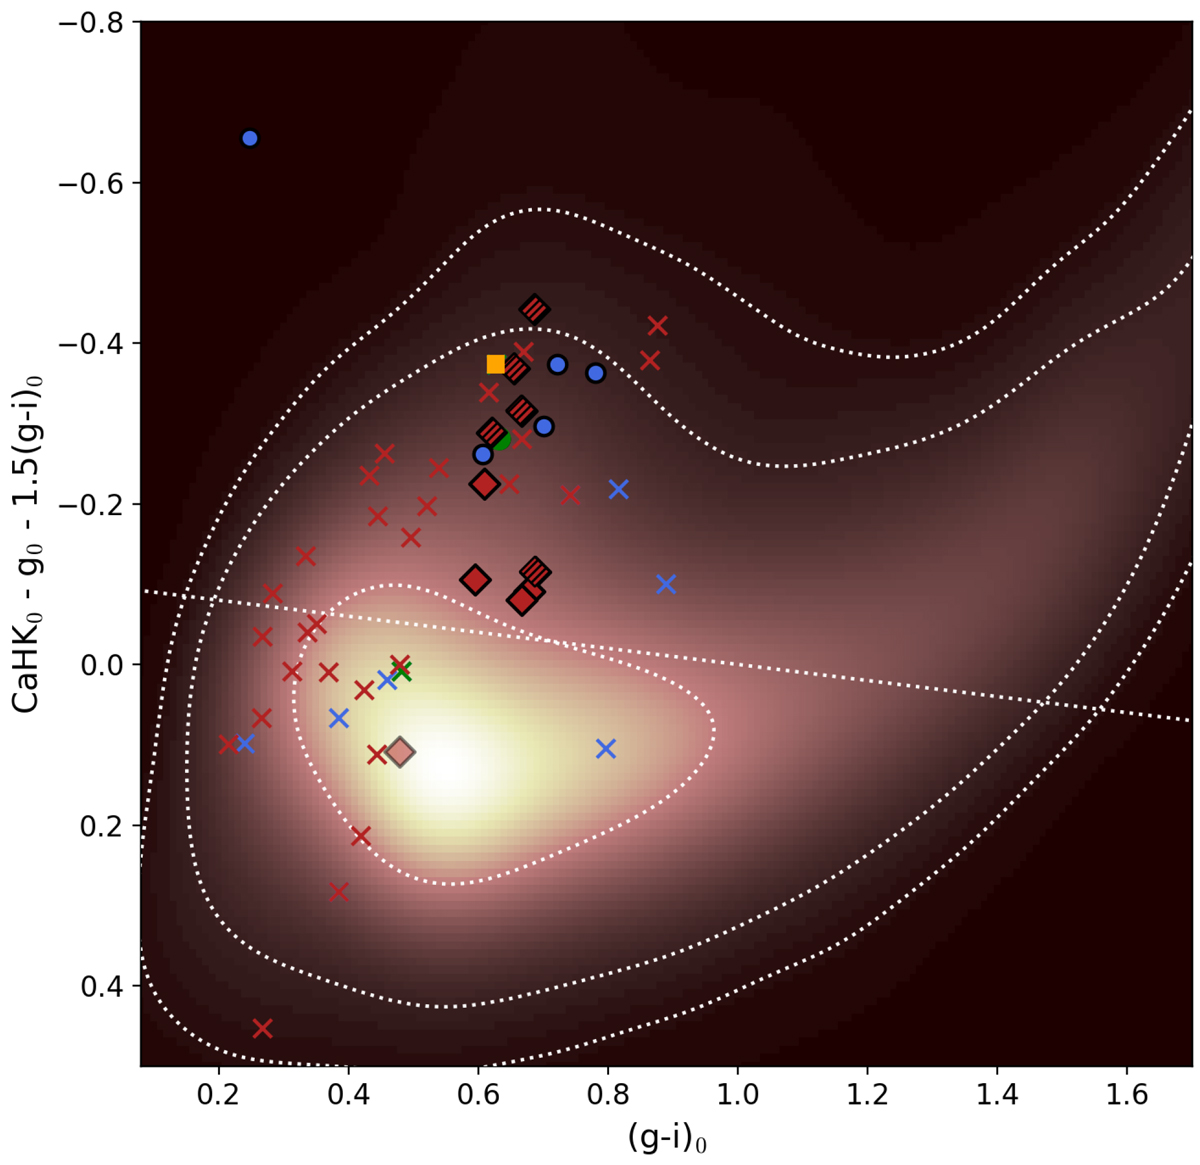
Fig. 5.
Download original image
CaHK colour–colour diagram, with the temperature proxy (g − i)0 on the x axis and the Pristine colour containing the metallicity-sensitive information. The density map in the background of the plot is produced using MW stars in the field of Boo II, with 1, 2 and 3σ contours shown as dotted white lines. In this diagram, the metallicity goes down as the y axis colour decreases. The dashed straight line shows the cut applied to the data to distinguish likely the metal-poor from the likely metal-rich stars. The colours and markers used are the same as those of Fig. 1.
Current usage metrics show cumulative count of Article Views (full-text article views including HTML views, PDF and ePub downloads, according to the available data) and Abstracts Views on Vision4Press platform.
Data correspond to usage on the plateform after 2015. The current usage metrics is available 48-96 hours after online publication and is updated daily on week days.
Initial download of the metrics may take a while.