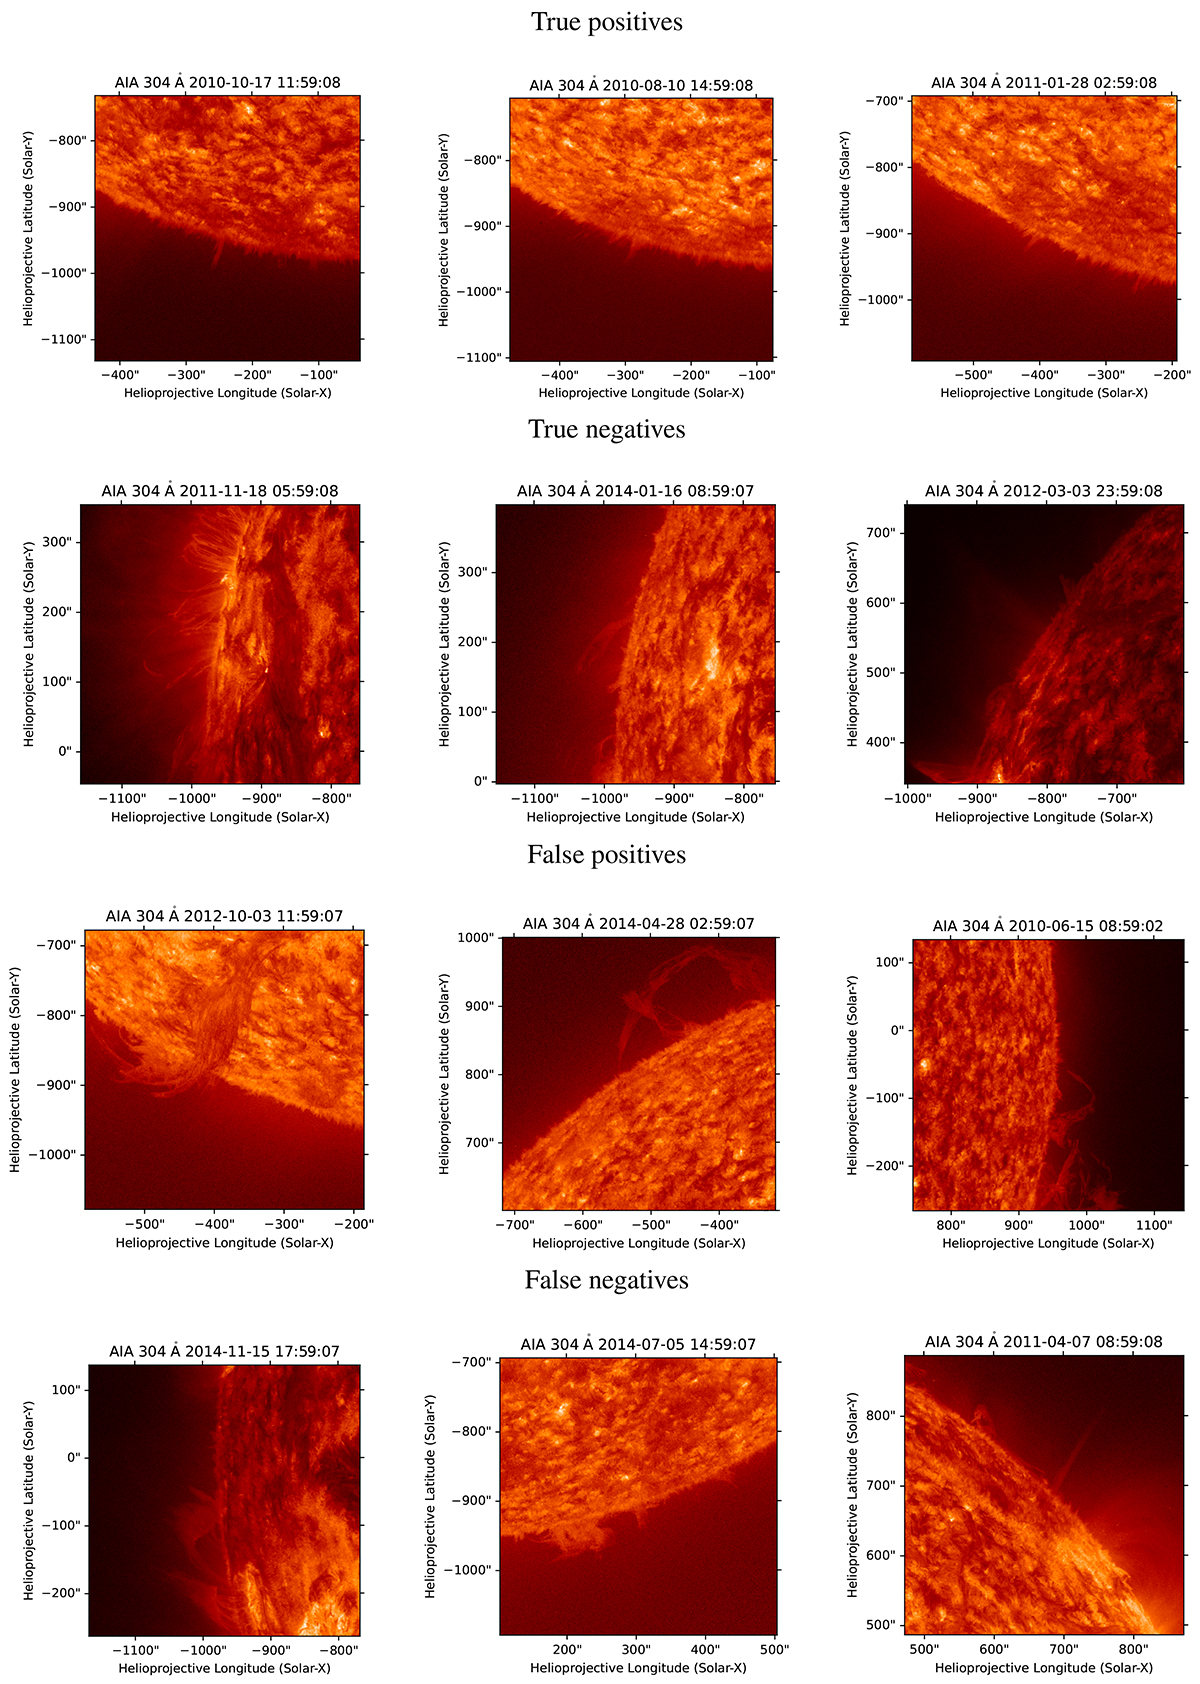
Fig. A.1.
Download original image
Illustrative examples of classification outcomes. Each row represents a classification category with three representative cases. The first row shows correctly identified coronal jets with well-defined, collimated structures and strong brightness contrast. The second row presents correctly identified non-jets, which appear diffuse and stable. The third row illustrates misclassified jets, where background features or localised brightenings were mistaken for jets. The fourth row shows missed jets, where real events were not recognised due to low contrast or projection effects.
Current usage metrics show cumulative count of Article Views (full-text article views including HTML views, PDF and ePub downloads, according to the available data) and Abstracts Views on Vision4Press platform.
Data correspond to usage on the plateform after 2015. The current usage metrics is available 48-96 hours after online publication and is updated daily on week days.
Initial download of the metrics may take a while.