Fig. 3
Download original image
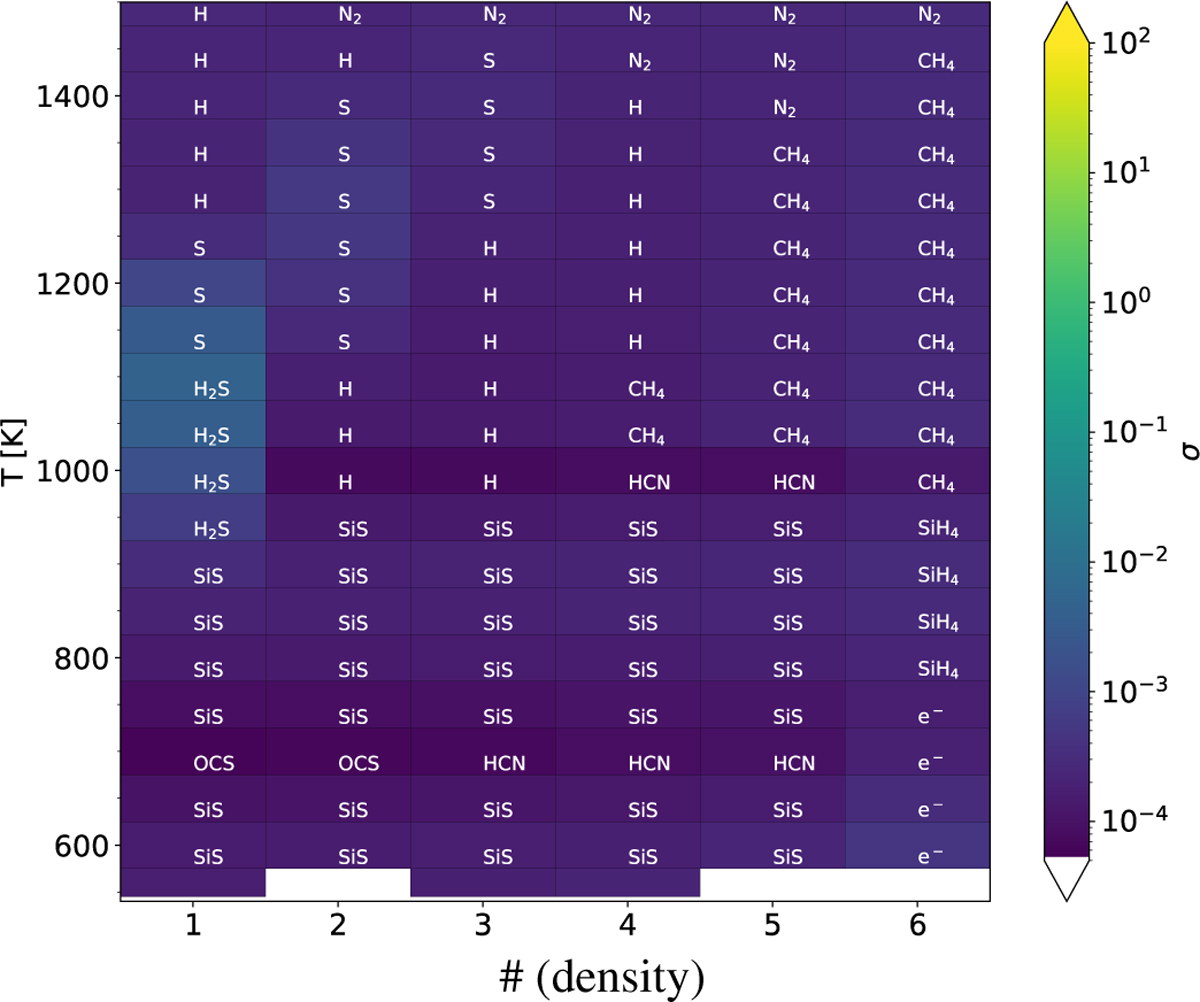
Deviation σ (see Eq. (19)), between particle densities obtained with time-independent PRODIMO (ni) and GGchem ![]() at various temperatures and densities from grid_0. The blank rectangles at the bottom mark the models which do not converge. The numbers on the x-axis correspond to the ascending list of densities in Table 5. The central white labels mark the species that contribute most to σ.
at various temperatures and densities from grid_0. The blank rectangles at the bottom mark the models which do not converge. The numbers on the x-axis correspond to the ascending list of densities in Table 5. The central white labels mark the species that contribute most to σ.
Current usage metrics show cumulative count of Article Views (full-text article views including HTML views, PDF and ePub downloads, according to the available data) and Abstracts Views on Vision4Press platform.
Data correspond to usage on the plateform after 2015. The current usage metrics is available 48-96 hours after online publication and is updated daily on week days.
Initial download of the metrics may take a while.