Fig. 7.
Download original image
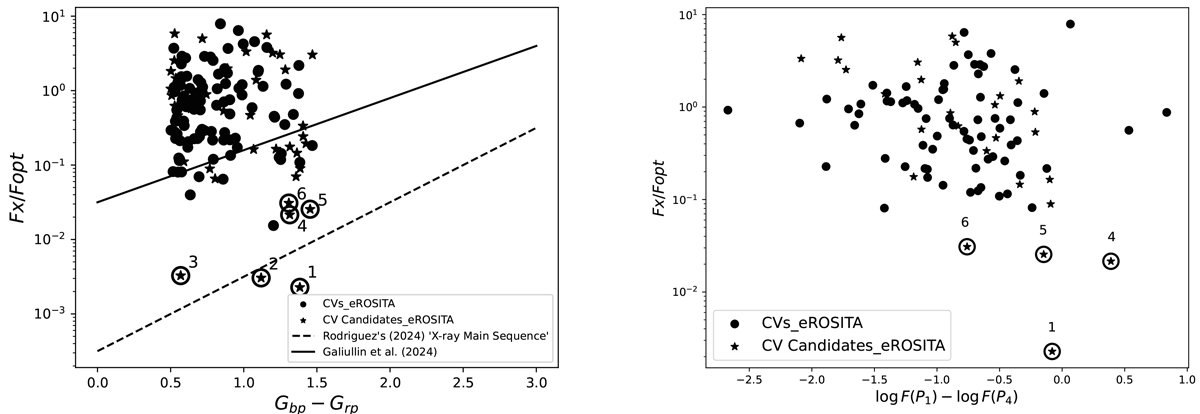
Ratio of X-ray flux (FX) in 0.2–8.0 keV energy bands to optical flux (Fopt) versus hardness of the optical bands (left panel) or the X-ray bands (right panel). The F(P1) and F(P4) represent the observed fluxes in P1 = 0.2 − 0.5 keV bands and P4 = 2.0 − 5.0 keV bands, respectively. The circles and stars correspond to the identified CVs and CV candidates for eROSITA sources with the detection of the periodic signal in ZTF/TESS data. The solid and dashed lines in the left panel are taken from Galiullin et al. (2024a) and Rodriguez (2024b), respectively. The six sources enclosed by the black circle are low-luminosity candidates corresponding to those in Fig. 6 and Table 5. The second source is missing from the right panel as its F(P4) is not measured, while the third source is missing because neither F(P1) nor F(P4) has been measured.
Current usage metrics show cumulative count of Article Views (full-text article views including HTML views, PDF and ePub downloads, according to the available data) and Abstracts Views on Vision4Press platform.
Data correspond to usage on the plateform after 2015. The current usage metrics is available 48-96 hours after online publication and is updated daily on week days.
Initial download of the metrics may take a while.