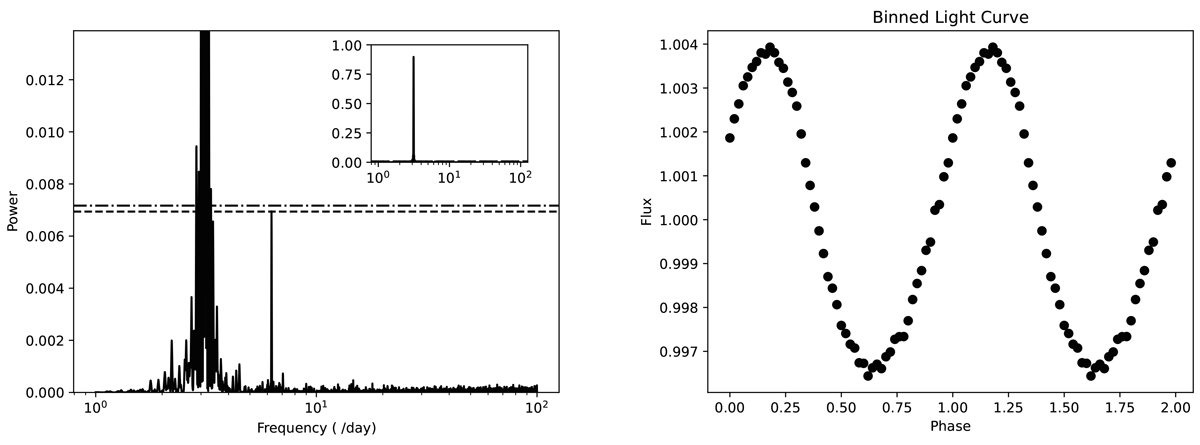
Fig. 4.
Download original image
LS periodogram (left panel) and folded light curve (right panel) with TESS data for Gaia DR3 5822540653269409408, which was selected as the counterpart of 1eRASS J155030.1–654403. The dashed black line and the dashed-dotted black line are (FAP = 0.01) determined by the methods of Baluev (2008) and the bootstrap of VanderPlas (2018), respectively. The LS diagram reveals an ∼3.13(3) day−1 modulation and its first harmonic. Two period cycles of the light curve are presented for clarity.
Current usage metrics show cumulative count of Article Views (full-text article views including HTML views, PDF and ePub downloads, according to the available data) and Abstracts Views on Vision4Press platform.
Data correspond to usage on the plateform after 2015. The current usage metrics is available 48-96 hours after online publication and is updated daily on week days.
Initial download of the metrics may take a while.