Fig. 7
Download original image
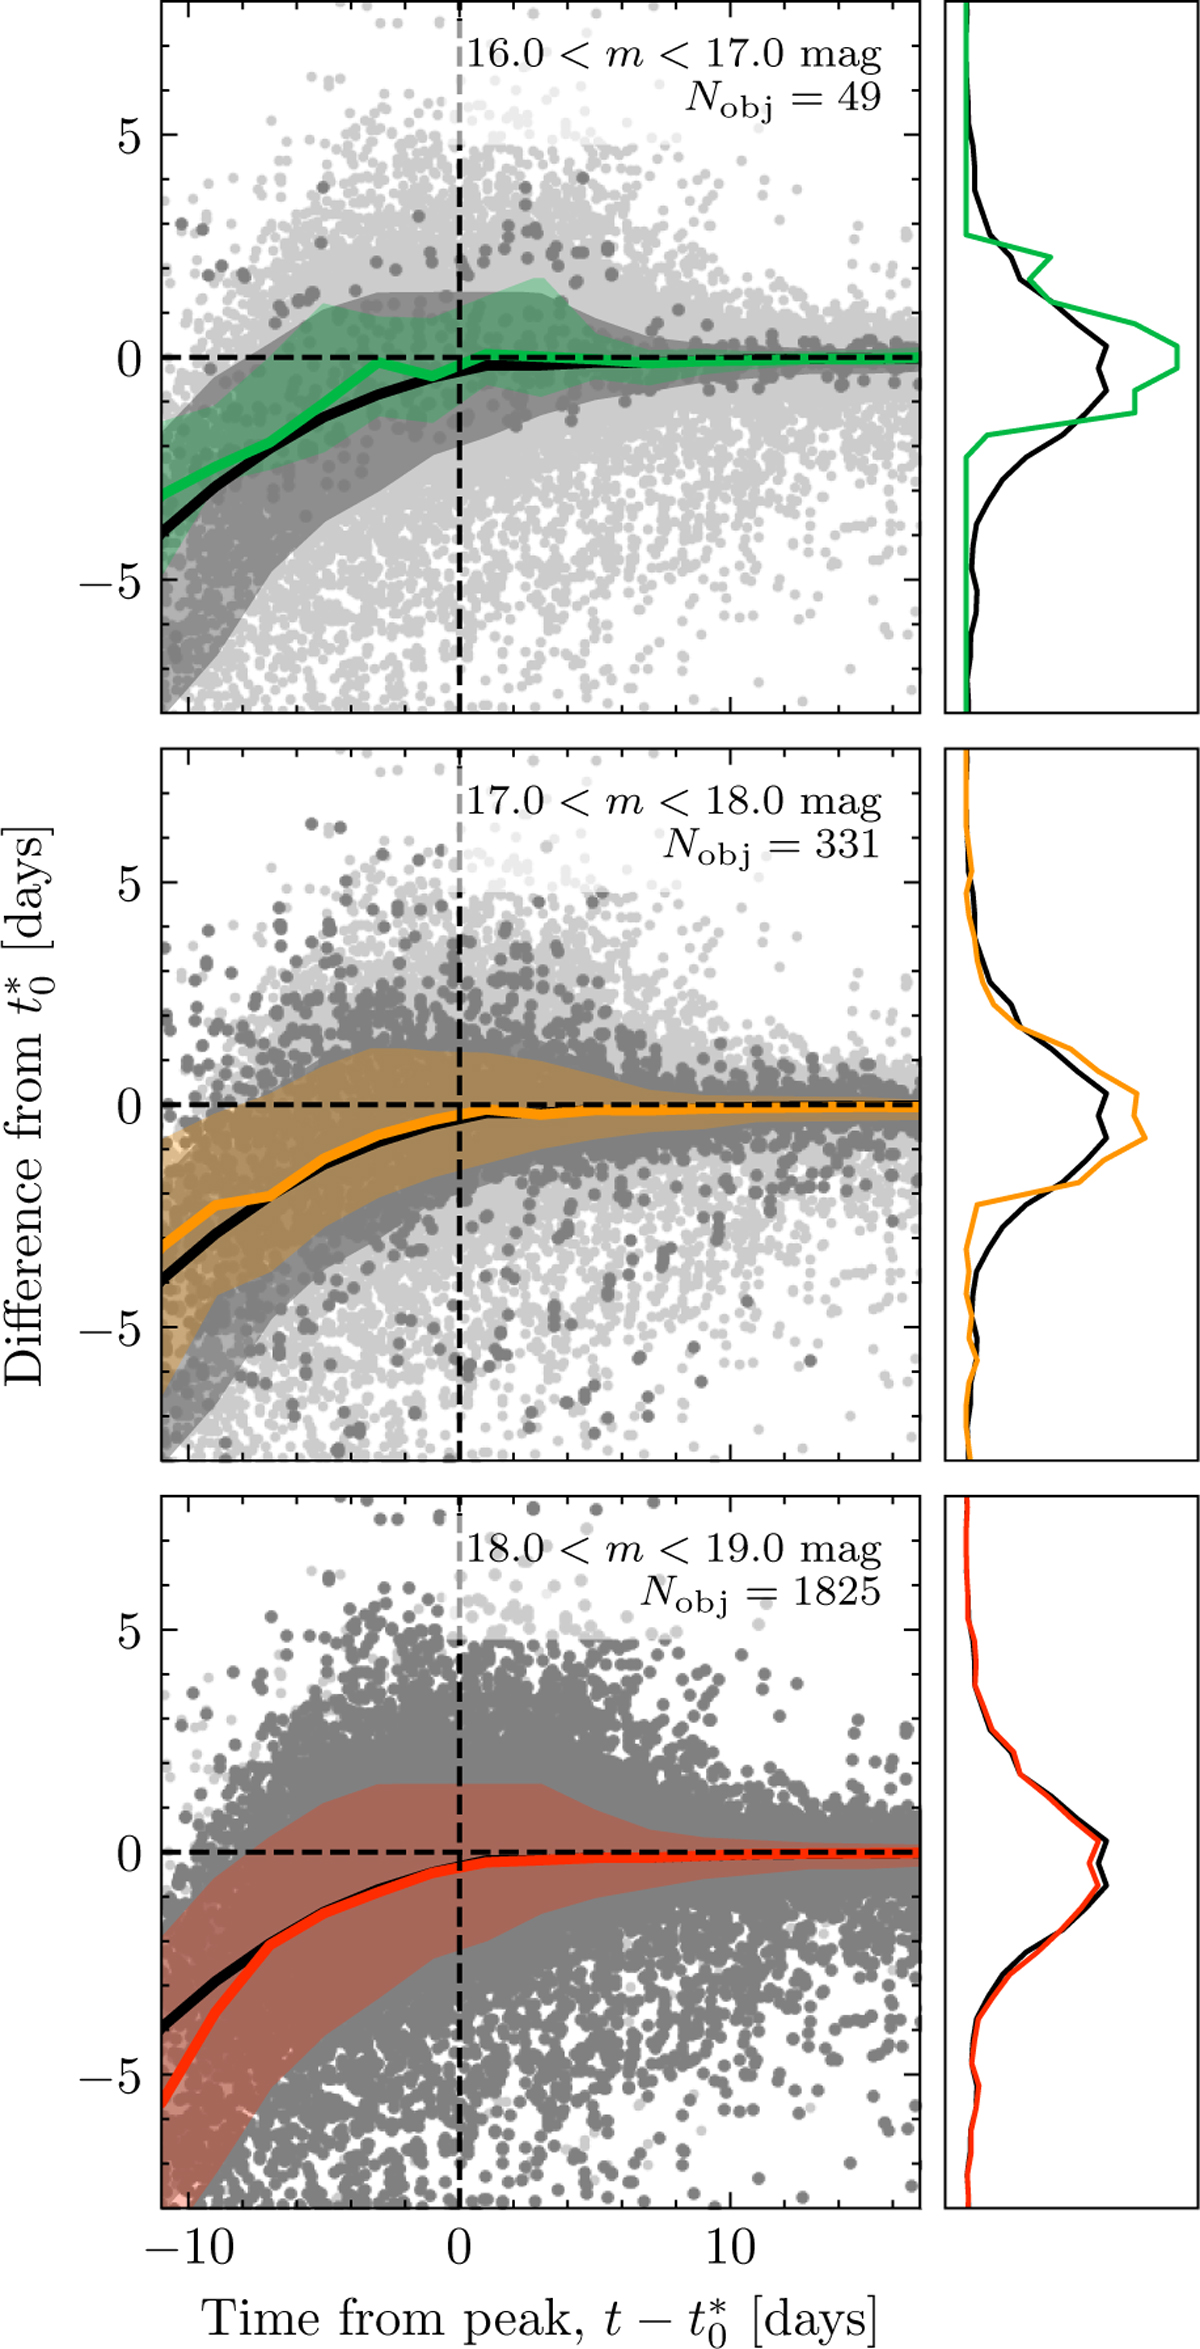
Convergence of the SALT zero-phase parameter t0, as a function of SN phase, separating candidates by their maximum model g measurement. Large, dark grey points are the ![]() differences as a function of time from
differences as a function of time from ![]() for candidates in that magnitude bin. The coloured solid line and shaded region in each panel show the median and central 68% region of the candidates in that magnitude bin. The light grey points, median in black and 68% region in grey for the entire sample are shown as in Fig. 6. The auxiliary axes to the left of the main panels are the normalised distribution of differences
for candidates in that magnitude bin. The coloured solid line and shaded region in each panel show the median and central 68% region of the candidates in that magnitude bin. The light grey points, median in black and 68% region in grey for the entire sample are shown as in Fig. 6. The auxiliary axes to the left of the main panels are the normalised distribution of differences ![]() in the
in the ![]() interval [−1, +1]. The black curve (the same in each panel) is for the full sample.
interval [−1, +1]. The black curve (the same in each panel) is for the full sample.
Current usage metrics show cumulative count of Article Views (full-text article views including HTML views, PDF and ePub downloads, according to the available data) and Abstracts Views on Vision4Press platform.
Data correspond to usage on the plateform after 2015. The current usage metrics is available 48-96 hours after online publication and is updated daily on week days.
Initial download of the metrics may take a while.