Fig. 6
Download original image
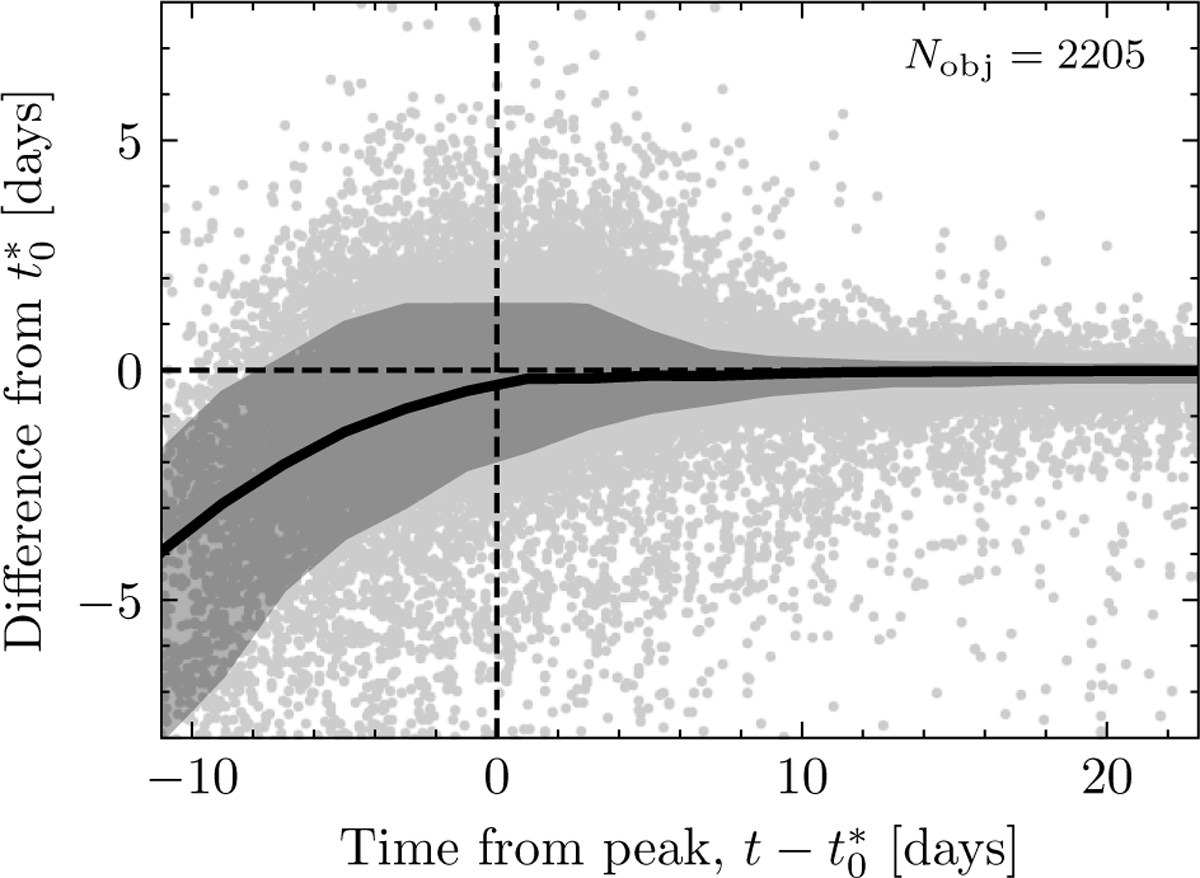
Convergence SALT2 zero-phase parameter t0 to the final ‘best’ estimate, ![]() , as a function of SN phase. We compute the difference in days between the ‘latest’ value of t0 (the value using the first N detections in g and r) and
, as a function of SN phase. We compute the difference in days between the ‘latest’ value of t0 (the value using the first N detections in g and r) and ![]() . The horizontal dashed line is where
. The horizontal dashed line is where ![]() . Points about this line are overestimates of t0 in comparison to
. Points about this line are overestimates of t0 in comparison to ![]() . We plot the median
. We plot the median ![]() and 68% confidence interval (solid black line and shaded region), estimated in bins of two days, which is the average ZTF cadence.
and 68% confidence interval (solid black line and shaded region), estimated in bins of two days, which is the average ZTF cadence.
Current usage metrics show cumulative count of Article Views (full-text article views including HTML views, PDF and ePub downloads, according to the available data) and Abstracts Views on Vision4Press platform.
Data correspond to usage on the plateform after 2015. The current usage metrics is available 48-96 hours after online publication and is updated daily on week days.
Initial download of the metrics may take a while.