Fig. 4
Download original image
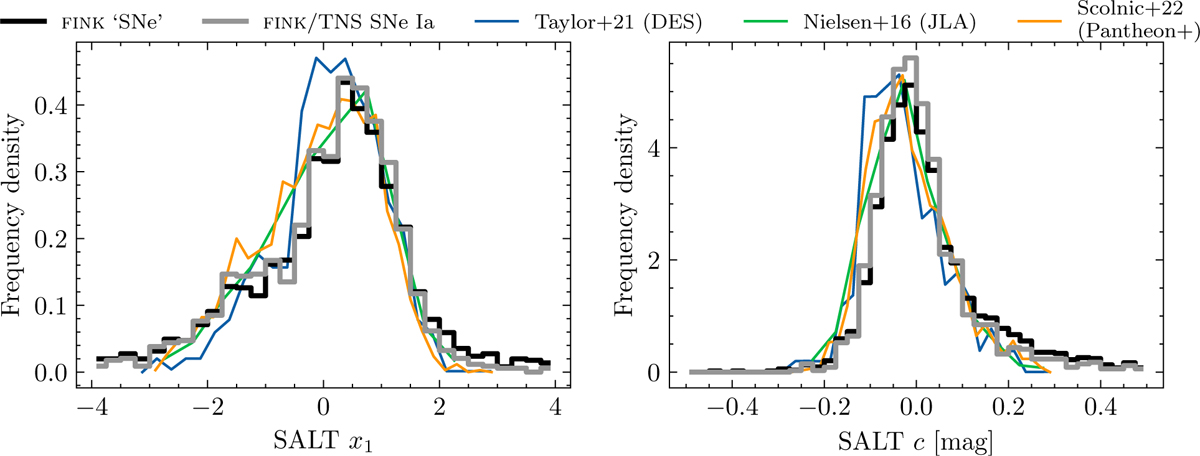
Distribution of SALT2 stretch parameter x1 (left panel) and colour parameter c (right panel) for all light curves with eight or more detections, for the sample of 2205 light curves that meet our criteria (black), and for the subset of 1383 that are spectroscopically confirmed SNe Ia in TNS (grey). Distributions of x1 (left panel) and c are also shown from Taylor et al. (2021) using the Dark Energy Survey (DES) supernovae sample (blue line; taken from their Fig. 9), from Nielsen et al. (2016) using the Joint Lightcurve Analysis (JLA) sample (green; taken from their Fig. 1), and from Scolnic et al. (2022) using the Pantheon+ sample (orange).
Current usage metrics show cumulative count of Article Views (full-text article views including HTML views, PDF and ePub downloads, according to the available data) and Abstracts Views on Vision4Press platform.
Data correspond to usage on the plateform after 2015. The current usage metrics is available 48-96 hours after online publication and is updated daily on week days.
Initial download of the metrics may take a while.