Fig. 2
Download original image
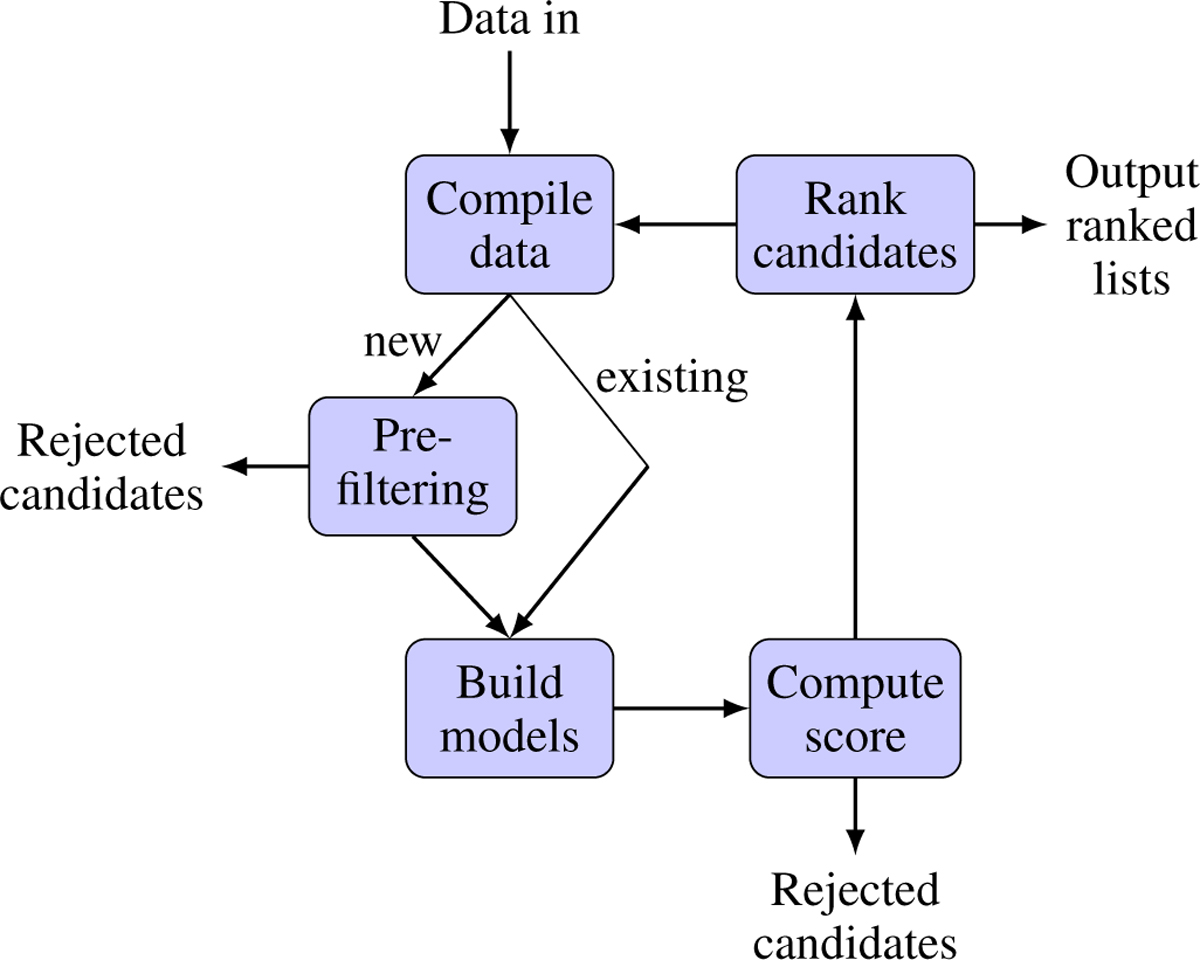
Prioritisation loop of AAS2RTO. First, data is compiled (step (1); Sect. 2.1) from broadcasting services (e.g. ZTF/LSST brokers) and non-broadcasting services (e.g. ATLAS/TNS). A pre-filtering step (step (2)) identifies new candidates which can immediately be removed without detailed modelling or visibility considerations. Theoretical models (e.g. light curve fits) are fit to new candidates (step (3)), or candidates which have received new data/alerts in the data compilation step. The full score is computed for each candidate (step (5); Sect. 2.3), considering the light curve, and models fit in the previous step, and observing site conditions. Finally, list of candidates are produced, in order of descending score (step (6); Sect. 2.4).
Current usage metrics show cumulative count of Article Views (full-text article views including HTML views, PDF and ePub downloads, according to the available data) and Abstracts Views on Vision4Press platform.
Data correspond to usage on the plateform after 2015. The current usage metrics is available 48-96 hours after online publication and is updated daily on week days.
Initial download of the metrics may take a while.